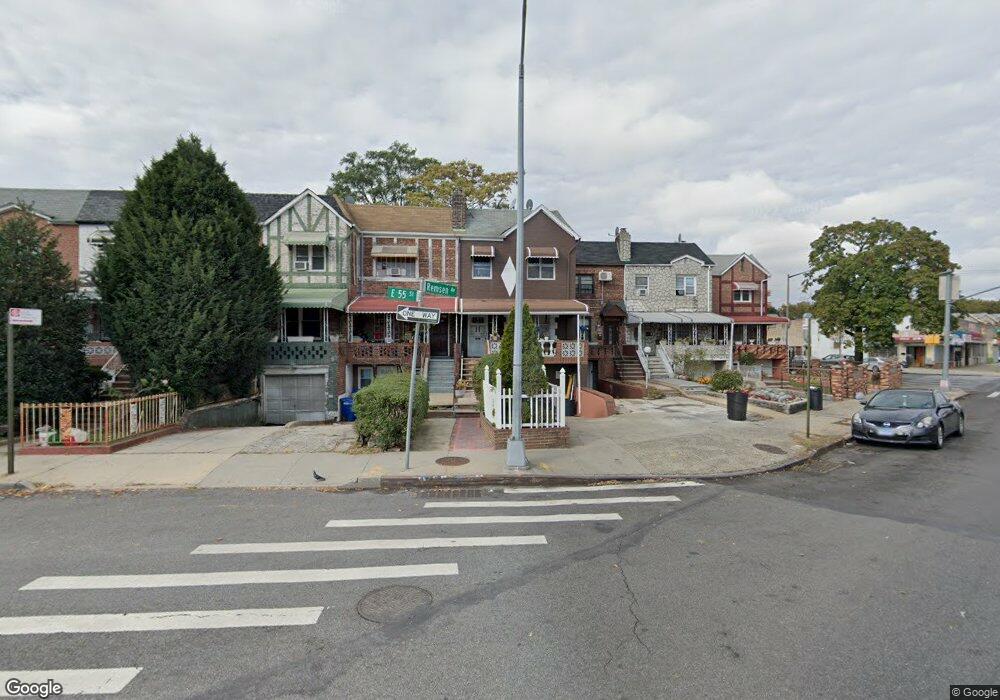
256 Remsen Ave Brooklyn, NY 11212
East Flatbush NeighborhoodEstimated Value: $713,000 - $858,000
--
Bed
2
Baths
2,400
Sq Ft
$335/Sq Ft
Est. Value
About This Home
This home is located at 256 Remsen Ave, Brooklyn, NY 11212 and is currently estimated at $803,181, approximately $334 per square foot. 256 Remsen Ave is a home located in Kings County with nearby schools including P.S. 268 Emma Lazarus, East Flatbush Community Research School, and Kings Elementary School.
Ownership History
Date
Name
Owned For
Owner Type
Purchase Details
Closed on
Feb 15, 2018
Sold by
Rpkholdings Llc
Bought by
Minkowitz Carlo S
Current Estimated Value
Home Financials for this Owner
Home Financials are based on the most recent Mortgage that was taken out on this home.
Original Mortgage
$569,500
Outstanding Balance
$482,315
Interest Rate
3.99%
Mortgage Type
New Conventional
Estimated Equity
$320,866
Purchase Details
Closed on
Jun 12, 2017
Sold by
Residential Mortgage Loan Trust 2013-Tt2
Bought by
Rpk Holdings Llc
Purchase Details
Closed on
Nov 18, 2015
Sold by
Wells Fargo Bank N A As Certificate T
Bought by
Residential Mortgage Loan Trust 2013-Tt2
Purchase Details
Closed on
Nov 20, 2014
Sold by
Barrenbaum Referee Morris Esq
Bought by
Wells Fargo Bank N A As Certificate Tru
Purchase Details
Closed on
Feb 6, 1995
Sold by
Hewitt Michelle and Leggard Neil
Bought by
Hewitt Michelle
Create a Home Valuation Report for This Property
The Home Valuation Report is an in-depth analysis detailing your home's value as well as a comparison with similar homes in the area
Home Values in the Area
Average Home Value in this Area
Purchase History
| Date | Buyer | Sale Price | Title Company |
|---|---|---|---|
| Minkowitz Carlo S | $670,000 | -- | |
| Minkowitz Carlo S | $670,000 | -- | |
| Rpk Holdings Llc | $360,000 | -- | |
| Rpk Holdings Llc | $360,000 | -- | |
| Residential Mortgage Loan Trust 2013-Tt2 | -- | -- | |
| Residential Mortgage Loan Trust 2013-Tt2 | -- | -- | |
| Wells Fargo Bank N A As Certificate Tru | $242,000 | -- | |
| Wells Fargo Bank N A As Certificate Tru | $242,000 | -- | |
| Hewitt Michelle | -- | Chicago Title Insurance Co | |
| Hewitt Michelle | -- | Chicago Title Insurance Co |
Source: Public Records
Mortgage History
| Date | Status | Borrower | Loan Amount |
|---|---|---|---|
| Open | Minkowitz Carlo S | $569,500 | |
| Closed | Minkowitz Carlo S | $569,500 |
Source: Public Records
Tax History Compared to Growth
Tax History
| Year | Tax Paid | Tax Assessment Tax Assessment Total Assessment is a certain percentage of the fair market value that is determined by local assessors to be the total taxable value of land and additions on the property. | Land | Improvement |
|---|---|---|---|---|
| 2025 | $4,789 | $45,660 | $15,060 | $30,600 |
| 2024 | $4,789 | $38,520 | $15,060 | $23,460 |
| 2023 | $4,843 | $46,800 | $15,060 | $31,740 |
| 2022 | $4,724 | $40,500 | $15,060 | $25,440 |
| 2021 | $4,699 | $35,640 | $15,060 | $20,580 |
| 2020 | $3,524 | $35,340 | $15,060 | $20,280 |
| 2019 | $4,157 | $33,840 | $15,060 | $18,780 |
| 2018 | $4,051 | $19,872 | $12,789 | $7,083 |
| 2017 | $4,020 | $19,722 | $10,249 | $9,473 |
| 2016 | $3,720 | $18,606 | $12,036 | $6,570 |
| 2015 | $2,507 | $17,553 | $11,083 | $6,470 |
| 2014 | $2,507 | $16,560 | $12,540 | $4,020 |
Source: Public Records
Map
Nearby Homes