Estimated Value: $262,000 - $286,000
3
Beds
2
Baths
1,316
Sq Ft
$209/Sq Ft
Est. Value
About This Home
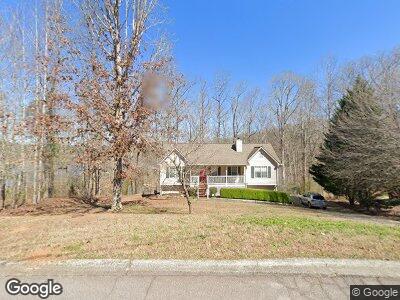
This home is located at 256 Thornbrooke Dr Unit 42, Hiram, GA 30141 and is currently estimated at $274,395, approximately $208 per square foot. 256 Thornbrooke Dr Unit 42 is a home located in Paulding County with nearby schools including Sam D. Panter Elementary School, J. A. Dobbins Middle School, and Hiram High School.
Ownership History
Date
Name
Owned For
Owner Type
Purchase Details
Closed on
Jul 2, 2018
Sold by
Rice Ryan R
Bought by
Ragland Bernadette
Current Estimated Value
Home Financials for this Owner
Home Financials are based on the most recent Mortgage that was taken out on this home.
Original Mortgage
$153,917
Outstanding Balance
$135,321
Interest Rate
4.5%
Mortgage Type
VA
Estimated Equity
$140,720
Purchase Details
Closed on
Mar 24, 2000
Sold by
Drawhorn James A and Drawhorn Shirley R
Bought by
Rice Ryan R
Home Financials for this Owner
Home Financials are based on the most recent Mortgage that was taken out on this home.
Original Mortgage
$86,950
Interest Rate
8.29%
Mortgage Type
New Conventional
Purchase Details
Closed on
Dec 20, 1996
Sold by
Hunter Bldr
Bought by
Gaynor Steven Tracy
Purchase Details
Closed on
Feb 1, 1996
Sold by
Larry Hunter Builder Inc
Purchase Details
Closed on
Dec 1, 1995
Sold by
Sweetwater Glen
Create a Home Valuation Report for This Property
The Home Valuation Report is an in-depth analysis detailing your home's value as well as a comparison with similar homes in the area
Home Values in the Area
Average Home Value in this Area
Purchase History
| Date | Buyer | Sale Price | Title Company |
|---|---|---|---|
| Ragland Bernadette | $149,000 | -- | |
| Rice Ryan R | $92,500 | -- | |
| Gaynor Steven Tracy | $101,000 | -- |
Source: Public Records
Mortgage History
| Date | Status | Borrower | Loan Amount |
|---|---|---|---|
| Open | Ragland Bernadette | $153,917 | |
| Previous Owner | Rice Ryan R | $90,500 | |
| Previous Owner | Rice Ryan R | $86,950 | |
| Closed | Gaynor Steven Tracy | $0 |
Source: Public Records
Tax History Compared to Growth
Tax History
| Year | Tax Paid | Tax Assessment Tax Assessment Total Assessment is a certain percentage of the fair market value that is determined by local assessors to be the total taxable value of land and additions on the property. | Land | Improvement |
|---|---|---|---|---|
| 2024 | $2,639 | $109,324 | $12,000 | $97,324 |
| 2023 | $2,890 | $113,396 | $12,000 | $101,396 |
| 2022 | $2,108 | $82,740 | $12,000 | $70,740 |
| 2021 | $1,878 | $66,504 | $8,000 | $58,504 |
| 2020 | $1,775 | $61,620 | $8,000 | $53,620 |
| 2019 | $1,734 | $59,392 | $8,000 | $51,392 |
| 2018 | $1,475 | $50,816 | $8,000 | $42,816 |
| 2017 | $1,367 | $46,596 | $8,000 | $38,596 |
| 2016 | $1,260 | $43,520 | $8,000 | $35,520 |
| 2015 | $1,156 | $39,400 | $8,000 | $31,400 |
| 2014 | $986 | $33,080 | $8,000 | $25,080 |
| 2013 | -- | $23,240 | $8,000 | $15,240 |
Source: Public Records
Map
Nearby Homes
- 256 Thornbrooke Dr Unit 42
- 256 Thornbrooke Dr
- 250 Thornbrooke Dr
- 272 Thornbrooke Dr
- 220 Thornbrooke Dr Unit 44
- 220 Thornbrooke Dr
- 259 Thornbrooke Dr
- 223 Thornbrooke Dr
- 306 Thornbrooke Dr
- 313 Thornbrooke Dr
- 313 Thornbrooke Dr Unit 23
- 204 Thornbrooke Dr
- 328 Thornbrooke Dr
- 189 Thornbrooke Dr
- 188 Thornbrooke Dr
- 149 Thornbrooke Dr
- 331 Thornbrooke Dr
- 2 Mayfield Ct
- 1 Mayfield Ct
- 176 Thornbrooke Dr