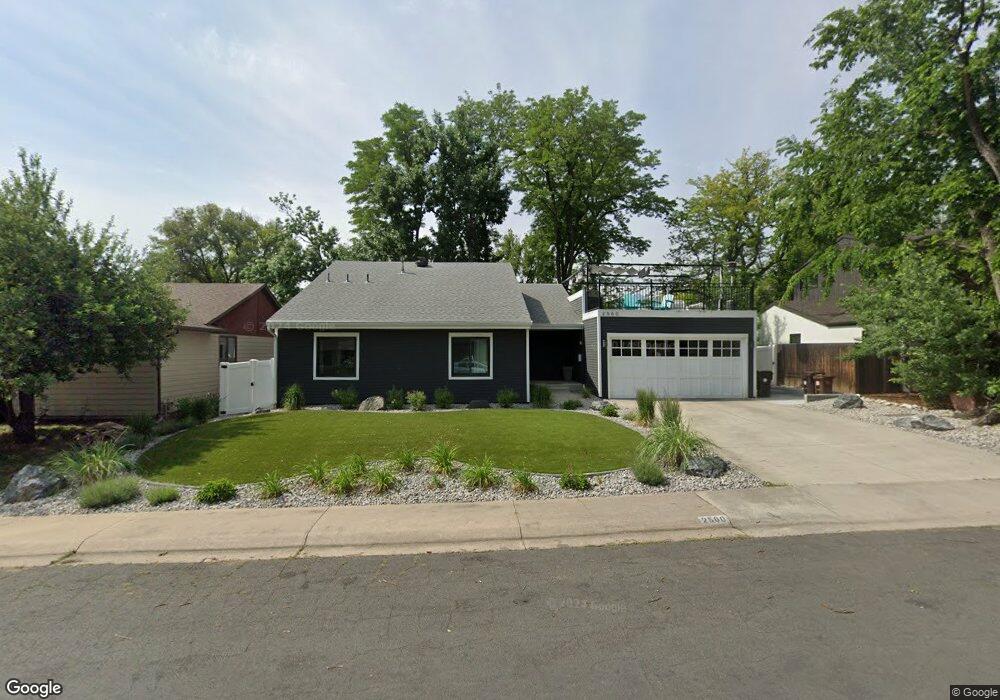
2560 Grape Ave Boulder, CO 80304
Central Boulder NeighborhoodEstimated Value: $1,112,000 - $1,717,000
3
Beds
2
Baths
1,562
Sq Ft
$899/Sq Ft
Est. Value
About This Home
This home is located at 2560 Grape Ave, Boulder, CO 80304 and is currently estimated at $1,404,483, approximately $899 per square foot. 2560 Grape Ave is a home located in Boulder County with nearby schools including Columbine Elementary School, Casey Middle School, and Boulder High School.
Ownership History
Date
Name
Owned For
Owner Type
Purchase Details
Closed on
Apr 19, 2004
Sold by
Daily Richard W and Estate Of Lois W Daily
Bought by
Pearson Albert W
Current Estimated Value
Home Financials for this Owner
Home Financials are based on the most recent Mortgage that was taken out on this home.
Original Mortgage
$300,000
Outstanding Balance
$138,809
Interest Rate
5.42%
Mortgage Type
Purchase Money Mortgage
Estimated Equity
$1,265,674
Purchase Details
Closed on
Mar 2, 1993
Bought by
Pearson Albert W V and Pearson Britt V
Purchase Details
Closed on
Jun 3, 1992
Bought by
Pearson Albert W V and Pearson Britt V
Purchase Details
Closed on
Jul 24, 1987
Bought by
Pearson Albert W V and Pearson Britt V
Purchase Details
Closed on
Oct 7, 1986
Bought by
Pearson Albert W V and Pearson Britt V
Create a Home Valuation Report for This Property
The Home Valuation Report is an in-depth analysis detailing your home's value as well as a comparison with similar homes in the area
Home Values in the Area
Average Home Value in this Area
Purchase History
| Date | Buyer | Sale Price | Title Company |
|---|---|---|---|
| Pearson Albert W | $375,000 | First Colorado Title | |
| Pearson Albert W V | -- | -- | |
| Pearson Albert W V | $181,000 | -- | |
| Pearson Albert W V | $128,000 | -- | |
| Pearson Albert W V | $32,000 | -- |
Source: Public Records
Mortgage History
| Date | Status | Borrower | Loan Amount |
|---|---|---|---|
| Open | Pearson Albert W | $300,000 | |
| Closed | Pearson Albert W | $37,500 |
Source: Public Records
Tax History
| Year | Tax Paid | Tax Assessment Tax Assessment Total Assessment is a certain percentage of the fair market value that is determined by local assessors to be the total taxable value of land and additions on the property. | Land | Improvement |
|---|---|---|---|---|
| 2025 | $8,184 | $87,125 | $52,700 | $34,425 |
| 2024 | $8,184 | $87,125 | $52,700 | $34,425 |
| 2023 | $8,042 | $93,123 | $55,891 | $40,917 |
| 2022 | $6,783 | $73,046 | $42,826 | $30,220 |
| 2021 | $6,468 | $75,147 | $44,058 | $31,089 |
| 2020 | $5,742 | $65,966 | $49,192 | $16,774 |
| 2019 | $5,654 | $65,966 | $49,192 | $16,774 |
| 2018 | $5,084 | $58,644 | $36,360 | $22,284 |
| 2017 | $4,925 | $64,834 | $40,198 | $24,636 |
| 2016 | $4,794 | $55,386 | $38,367 | $17,019 |
| 2015 | $4,540 | $45,213 | $22,447 | $22,766 |
| 2014 | $3,802 | $45,213 | $22,447 | $22,766 |
Source: Public Records
Map
Nearby Homes
- 2595 Glenwood Dr
- 3225 Arnett St
- 2435 Hawthorn Ave
- 3145 Fremont St
- 2540 Iris Ave
- 2270 Grape Ave
- 2645 Tabriz Place Unit 22
- 3120 Eastwood Ct
- 2636 Juniper Ave Unit 1
- 2707 Valmont Rd Unit D-304
- 2707 Valmont Rd Unit 106 Bonus!
- 2707 Valmont Rd Unit 311A
- 3055 23rd St
- 2991 25th St
- 2025 Hermosa Dr
- 2727 Folsom St Unit 303
- 2727 Folsom St Unit 115
- 3535 28th St Unit 101
- 2624 Kalmia Ave
- 3545 28th St Unit 304
- 3247 Folsom St
- 2530 Grape Ave
- 2575 Glenwood Dr
- 2555 Glenwood Dr
- 2510 Grape Ave
- 2565 Grape Ave
- 2595 Grape Ave
- 2535 Glenwood Dr
- 2535 Grape Ave
- 2490 Grape Ave
- 2515 Glenwood Dr
- 3230 Folsom St
- 2515 Grape Ave
- 2515 Grape Ave Unit B
- 2649 Grapewood Ln
- 2647 Grapewood Ln
- 2647 Grapewood Ln Unit 1
- 2570 Glenwood Dr
- 2643 Grapewood Ln
- 2560 Hawthorn Ave
Your Personal Tour Guide
Ask me questions while you tour the home.