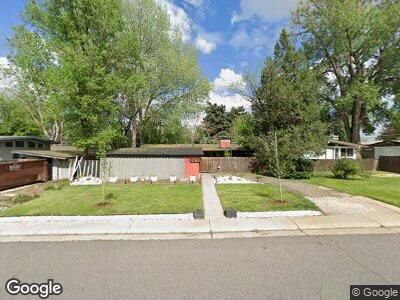
2560 S Meade St Denver, CO 80219
Harvey Park NeighborhoodEstimated Value: $547,000 - $610,000
3
Beds
1
Bath
1,037
Sq Ft
$545/Sq Ft
Est. Value
About This Home
This home is located at 2560 S Meade St, Denver, CO 80219 and is currently estimated at $565,086, approximately $544 per square foot. 2560 S Meade St is a home located in Denver County with nearby schools including Doull Elementary School, Bear Valley International School, and Excel Academy.
Ownership History
Date
Name
Owned For
Owner Type
Purchase Details
Closed on
May 30, 2014
Sold by
Padget Derek
Bought by
Westby Derek D
Current Estimated Value
Home Financials for this Owner
Home Financials are based on the most recent Mortgage that was taken out on this home.
Original Mortgage
$197,800
Interest Rate
3.5%
Mortgage Type
Adjustable Rate Mortgage/ARM
Purchase Details
Closed on
May 25, 2011
Sold by
Boin Michael D
Bought by
Padget Derek
Home Financials for this Owner
Home Financials are based on the most recent Mortgage that was taken out on this home.
Original Mortgage
$136,065
Interest Rate
3.37%
Mortgage Type
FHA
Purchase Details
Closed on
Dec 29, 2000
Sold by
Engle Andrea L
Bought by
Boin Michael D
Home Financials for this Owner
Home Financials are based on the most recent Mortgage that was taken out on this home.
Original Mortgage
$144,806
Interest Rate
7.78%
Mortgage Type
FHA
Create a Home Valuation Report for This Property
The Home Valuation Report is an in-depth analysis detailing your home's value as well as a comparison with similar homes in the area
Home Values in the Area
Average Home Value in this Area
Purchase History
| Date | Buyer | Sale Price | Title Company |
|---|---|---|---|
| Westby Derek D | $253,600 | Stewart Title | |
| Padget Derek | $141,000 | Stewart Title | |
| Boin Michael D | $146,000 | -- |
Source: Public Records
Mortgage History
| Date | Status | Borrower | Loan Amount |
|---|---|---|---|
| Open | Westby Derek D | $193,500 | |
| Open | Westby Derek D | $297,000 | |
| Closed | Westby Derek D | $304,000 | |
| Closed | Westby Derek D | $197,800 | |
| Previous Owner | Padget Derek | $15,000 | |
| Previous Owner | Padget Derek | $136,065 | |
| Previous Owner | Boin Michael D | $133,000 | |
| Previous Owner | Boin Michael D | $149,408 | |
| Previous Owner | Boin Michael D | $146,721 | |
| Previous Owner | Boin Michael D | $144,806 |
Source: Public Records
Tax History Compared to Growth
Tax History
| Year | Tax Paid | Tax Assessment Tax Assessment Total Assessment is a certain percentage of the fair market value that is determined by local assessors to be the total taxable value of land and additions on the property. | Land | Improvement |
|---|---|---|---|---|
| 2024 | $2,833 | $35,770 | $2,320 | $33,450 |
| 2023 | $2,772 | $35,770 | $2,320 | $33,450 |
| 2022 | $2,510 | $31,560 | $6,230 | $25,330 |
| 2021 | $2,422 | $32,460 | $6,410 | $26,050 |
| 2020 | $2,301 | $31,010 | $5,990 | $25,020 |
| 2019 | $2,236 | $31,010 | $5,990 | $25,020 |
| 2018 | $2,117 | $27,370 | $5,170 | $22,200 |
| 2017 | $2,111 | $27,370 | $5,170 | $22,200 |
| 2016 | $1,620 | $19,860 | $4,760 | $15,100 |
| 2015 | $1,552 | $19,860 | $4,760 | $15,100 |
| 2014 | $929 | $11,190 | $2,380 | $8,810 |
Source: Public Records
Map
Nearby Homes
- 2545 S Lowell Blvd
- 2435 S Meade St
- 2370 S Meade St
- 2767 S Linley Ct
- 2756 S Linley Ct
- 2744 S Newton Way
- 2544 S Raleigh St
- 2285 S Newton St
- 2391 S Quitman St
- 2566 S Stuart St
- 2548 S Tennyson Way
- 2213 S Meade St
- 2713 S Hazel Ct
- 2797 S Newton Way
- 2718 S Hazel Ct
- 2201 S Lowell Blvd
- 3198 W Amherst Ave
- 2666 S Green Ct
- 2205 S Irving St
- 2621 S Federal Blvd
- 2560 S Meade St
- 2550 S Meade St
- 2570 S Meade St
- 2565 S Lowell Blvd
- 2555 S Lowell Blvd
- 2575 S Lowell Blvd
- 2580 S Meade St
- 2540 S Meade St
- 2585 S Lowell Blvd
- 2575 S Meade St
- 2530 S Meade St
- 2555 S Meade St
- 2591 S Lowell Blvd
- 2535 S Lowell Blvd
- 2585 S Meade St
- 2565 S Meade St
- 2545 S Meade St
- 2596 S Meade St
- 2595 S Lowell Blvd
- 2520 S Meade St