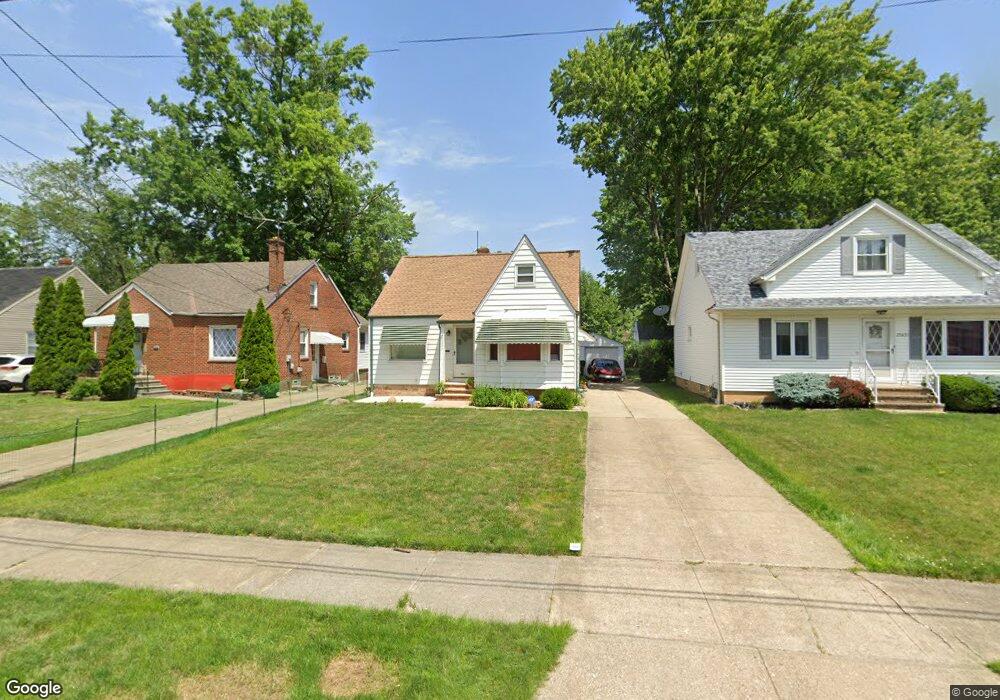
25601 Farringdon Ave Euclid, OH 44132
Estimated Value: $116,685 - $134,000
2
Beds
1
Bath
736
Sq Ft
$172/Sq Ft
Est. Value
About This Home
This home is located at 25601 Farringdon Ave, Euclid, OH 44132 and is currently estimated at $126,421, approximately $171 per square foot. 25601 Farringdon Ave is a home located in Cuyahoga County with nearby schools including Shoreview Elementary School, Euclid High School, and Ss Robert & William Catholic School.
Ownership History
Date
Name
Owned For
Owner Type
Purchase Details
Closed on
May 13, 2017
Sold by
Jones Yvonne
Bought by
Jones Robert Deshaun and Jones Rayquon Deron
Current Estimated Value
Purchase Details
Closed on
Aug 27, 2003
Sold by
Barbish June I
Bought by
Jones Yvonne
Home Financials for this Owner
Home Financials are based on the most recent Mortgage that was taken out on this home.
Original Mortgage
$87,400
Outstanding Balance
$39,790
Interest Rate
5.97%
Mortgage Type
Purchase Money Mortgage
Estimated Equity
$86,631
Purchase Details
Closed on
Aug 16, 1993
Sold by
Barbish Joseph and Barbish June I
Bought by
Barbish June I
Purchase Details
Closed on
Mar 12, 1980
Sold by
Barbish Joseph and Barbish June
Bought by
Barbish Joseph and Barbish June I
Purchase Details
Closed on
Jan 1, 1975
Bought by
Barbish Joseph and Barbish June
Create a Home Valuation Report for This Property
The Home Valuation Report is an in-depth analysis detailing your home's value as well as a comparison with similar homes in the area
Home Values in the Area
Average Home Value in this Area
Purchase History
| Date | Buyer | Sale Price | Title Company |
|---|---|---|---|
| Jones Robert Deshaun | -- | None Available | |
| Jones Yvonne | $92,000 | Executive Title Agency Corp | |
| Barbish June I | -- | -- | |
| Barbish Joseph | -- | -- | |
| Barbish Joseph | -- | -- |
Source: Public Records
Mortgage History
| Date | Status | Borrower | Loan Amount |
|---|---|---|---|
| Open | Jones Yvonne | $87,400 |
Source: Public Records
Tax History
| Year | Tax Paid | Tax Assessment Tax Assessment Total Assessment is a certain percentage of the fair market value that is determined by local assessors to be the total taxable value of land and additions on the property. | Land | Improvement |
|---|---|---|---|---|
| 2024 | $1,760 | $34,265 | $9,030 | $25,235 |
| 2023 | $1,491 | $25,450 | $6,860 | $18,590 |
| 2022 | $1,492 | $25,450 | $6,860 | $18,590 |
| 2021 | $1,651 | $25,450 | $6,860 | $18,590 |
| 2020 | $2,305 | $21,950 | $5,920 | $16,030 |
| 2019 | $2,070 | $62,700 | $16,900 | $45,800 |
| 2018 | $2,027 | $21,950 | $5,920 | $16,030 |
| 2017 | $2,129 | $18,660 | $4,900 | $13,760 |
| 2016 | $2,134 | $18,660 | $4,900 | $13,760 |
| 2015 | $1,945 | $18,660 | $4,900 | $13,760 |
| 2014 | $1,945 | $18,660 | $4,900 | $13,760 |
Source: Public Records
Map
Nearby Homes
- 25671 Farringdon Ave
- 25731 Zeman Ave
- 25401 Farringdon Ave
- 571 E 260th St
- 579 E 260th St
- 25751 Briardale Ave
- 25700 Briardale Ave
- 25151 Zeman Ave
- 643 E 261st St
- 25650 Richards Ave
- 26351 Farringdon Ave
- 515 E 250th St
- 464 E 250th St
- 24891 Zeman Ave
- 26430 Drakefield Ave
- 364 Walworth Ave
- 368 E 248th St
- 610 E 266th St
- 355 E 257th St
- 325 E 257th St
- 25551 Farringdon Ave
- 25631 Farringdon Ave
- 25651 Farringdon Ave
- 25531 Farringdon Ave
- 25521 Farringdon Ave
- 25600 Zeman Ave
- 25630 Zeman Ave
- 25550 Zeman Ave
- 25650 Zeman Ave
- 25530 Zeman Ave
- 25501 Farringdon Ave
- 25701 Farringdon Ave
- 25520 Zeman Ave
- 25670 Zeman Ave
- 25600 Farringdon Ave
- 25630 Farringdon Ave
- 25550 Farringdon Ave
- 25530 Farringdon Ave
- 25650 Farringdon Ave
- 25451 Farringdon Ave
Your Personal Tour Guide
Ask me questions while you tour the home.