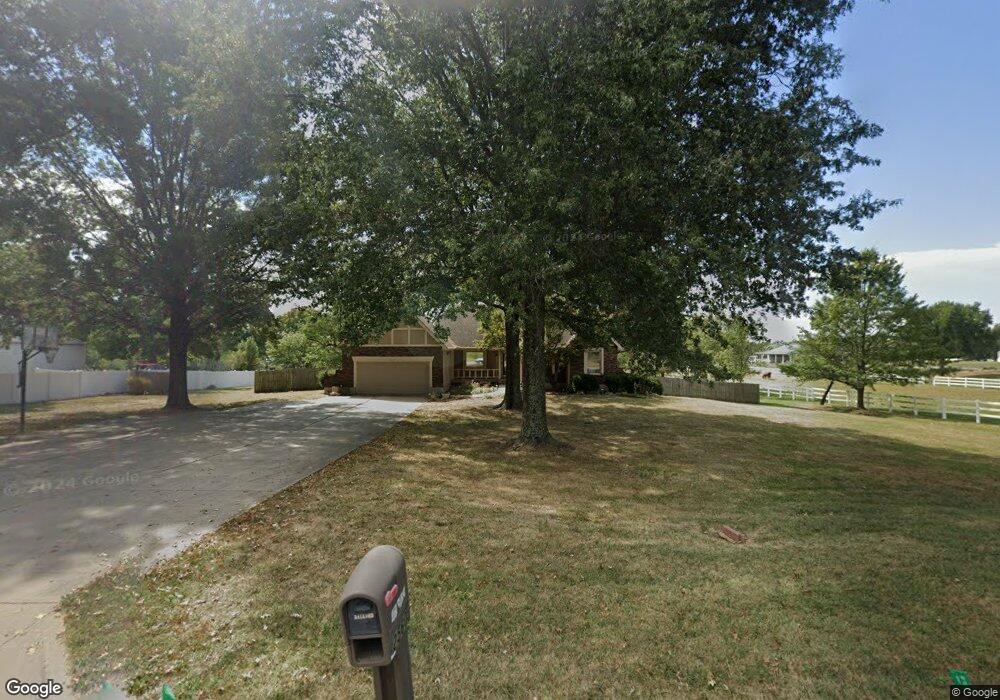
25605 NE Colbern Rd Lees Summit, MO 64086
Estimated Value: $466,910 - $574,000
3
Beds
3
Baths
1,641
Sq Ft
$321/Sq Ft
Est. Value
About This Home
This home is located at 25605 NE Colbern Rd, Lees Summit, MO 64086 and is currently estimated at $527,228, approximately $321 per square foot. 25605 NE Colbern Rd is a home located in Jackson County with nearby schools including Mason Elementary School, Bernard C. Campbell Middle School, and Lee's Summit North High School.
Ownership History
Date
Name
Owned For
Owner Type
Purchase Details
Closed on
Dec 1, 2011
Sold by
The Midwest Trust Company
Bought by
Ballard Lynn E
Current Estimated Value
Purchase Details
Closed on
Jul 19, 2004
Sold by
Ballard Brett
Bought by
Ballard Brett
Purchase Details
Closed on
Oct 30, 2001
Sold by
Ghani Masoud Mike and Birchfield Cathryn A
Bought by
Ballard Brett
Home Financials for this Owner
Home Financials are based on the most recent Mortgage that was taken out on this home.
Original Mortgage
$188,720
Interest Rate
6.77%
Mortgage Type
Purchase Money Mortgage
Purchase Details
Closed on
Aug 23, 2000
Sold by
Birchfield Allen R
Bought by
Birchfield Cathryn Ann
Create a Home Valuation Report for This Property
The Home Valuation Report is an in-depth analysis detailing your home's value as well as a comparison with similar homes in the area
Purchase History
| Date | Buyer | Sale Price | Title Company |
|---|---|---|---|
| Ballard Lynn E | -- | None Available | |
| Ballard Brett | -- | -- | |
| Ballard Brett | -- | Stewart Title | |
| Birchfield Cathryn Ann | -- | Stewart Title |
Source: Public Records
Mortgage History
| Date | Status | Borrower | Loan Amount |
|---|---|---|---|
| Closed | Ballard Brett | $188,720 |
Source: Public Records
Tax History
| Year | Tax Paid | Tax Assessment Tax Assessment Total Assessment is a certain percentage of the fair market value that is determined by local assessors to be the total taxable value of land and additions on the property. | Land | Improvement |
|---|---|---|---|---|
| 2025 | $5,652 | $63,321 | $22,625 | $40,696 |
| 2024 | $5,595 | $81,079 | $15,394 | $65,685 |
| 2023 | $5,595 | $81,078 | $16,028 | $65,050 |
| 2022 | $3,755 | $47,880 | $13,576 | $34,304 |
| 2021 | $3,591 | $47,880 | $13,576 | $34,304 |
| 2020 | $3,556 | $45,640 | $13,576 | $32,064 |
| 2019 | $3,475 | $45,640 | $13,576 | $32,064 |
| 2018 | $2,857 | $34,856 | $5,575 | $29,281 |
| 2016 | $2,883 | $34,846 | $9,443 | $25,403 |
Source: Public Records
Map
Nearby Homes
- 25408 NE Colbern Rd
- 1121 SW Brookside Ct
- 9208 SW Whispy Way
- 1108 SW Whispering Willow Way
- 26104 E 99th St
- 22 U St
- 904 SW Peach Tree Ln
- 19 U St
- 8913 SW 8th St
- 375 SW Amara Dr
- 8826 SW 10th St
- 8822 SW 10th St
- 8818 SW 10th St
- 8808 SW 9th St
- 8814 SW 10th St
- 8810 SW 10th St
- 8801 SW 10th St
- 8806 SW 10th St
- 8793 SW 10th St
- 8802 SW 10th St
- 25611 NE Colbern Rd
- 25505 NE Colbern Rd
- 9504 Timber Meadow Dr
- 25706 NE Colbern Rd
- 25612 NE Colbern Rd
- 25411 NE Colbern Rd
- 9514 Timber Meadow Dr
- 25604 NE Colbern Rd
- 25800 NE Colbern Rd
- 9600 Timber Meadow Dr
- 9509 Timber Meadow Dr
- 23706 E Colbern Rd
- 9515 Timber Meadow Dr
- 9408 Timber Meadows Dr
- 25401 NE Colbern Rd
- 9606 Timber Meadow Dr
- 9419 Timber Meadows Dr
- 25400 NE Colbern Rd
- 25901 NE Colbern Rd
- 25305 NE Colbern Rd
Your Personal Tour Guide
Ask me questions while you tour the home.