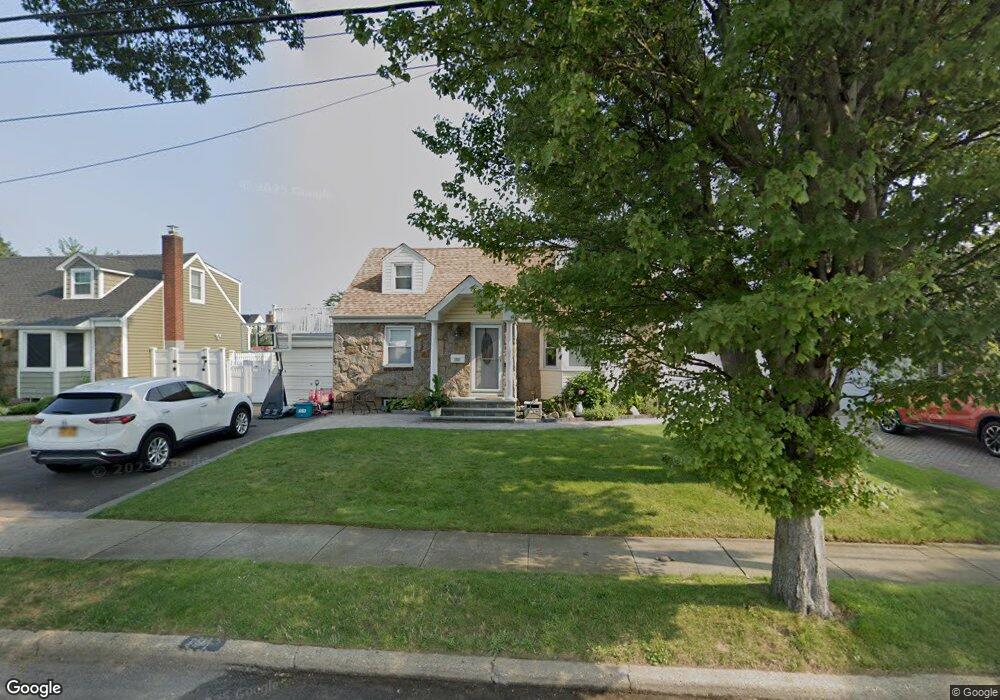
2561 7th Ave East Meadow, NY 11554
Estimated Value: $713,000 - $729,594
3
Beds
2
Baths
1,268
Sq Ft
$569/Sq Ft
Est. Value
About This Home
This home is located at 2561 7th Ave, East Meadow, NY 11554 and is currently estimated at $721,297, approximately $568 per square foot. 2561 7th Ave is a home located in Nassau County with nearby schools including Parkway School and Woodland Middle School.
Ownership History
Date
Name
Owned For
Owner Type
Purchase Details
Closed on
Jan 23, 2015
Sold by
Macchio Michael and Buccella Steven
Bought by
Tortora Johnathan and Tortora Toni
Current Estimated Value
Home Financials for this Owner
Home Financials are based on the most recent Mortgage that was taken out on this home.
Original Mortgage
$410,400
Outstanding Balance
$314,348
Interest Rate
3.84%
Mortgage Type
New Conventional
Estimated Equity
$406,949
Purchase Details
Closed on
Jul 22, 2005
Sold by
Ubertini Robert
Bought by
Macchio Michael
Create a Home Valuation Report for This Property
The Home Valuation Report is an in-depth analysis detailing your home's value as well as a comparison with similar homes in the area
Home Values in the Area
Average Home Value in this Area
Purchase History
| Date | Buyer | Sale Price | Title Company |
|---|---|---|---|
| Tortora Johnathan | $432,000 | None Available | |
| Macchio Michael | $458,350 | -- |
Source: Public Records
Mortgage History
| Date | Status | Borrower | Loan Amount |
|---|---|---|---|
| Open | Tortora Johnathan | $410,400 |
Source: Public Records
Tax History Compared to Growth
Tax History
| Year | Tax Paid | Tax Assessment Tax Assessment Total Assessment is a certain percentage of the fair market value that is determined by local assessors to be the total taxable value of land and additions on the property. | Land | Improvement |
|---|---|---|---|---|
| 2025 | $11,412 | $472 | $235 | $237 |
| 2024 | $3,484 | $472 | $235 | $237 |
| 2023 | $11,321 | $498 | $248 | $250 |
| 2022 | $11,321 | $472 | $235 | $237 |
| 2021 | $14,032 | $484 | $241 | $243 |
| 2020 | $10,809 | $605 | $538 | $67 |
| 2019 | $10,067 | $648 | $446 | $202 |
| 2018 | $10,313 | $691 | $0 | $0 |
| 2017 | $7,954 | $808 | $576 | $232 |
| 2016 | $11,696 | $808 | $576 | $232 |
| 2015 | -- | $808 | $576 | $232 |
| 2014 | -- | $808 | $576 | $232 |
| 2013 | $3,285 | $808 | $576 | $232 |
Source: Public Records
Map
Nearby Homes