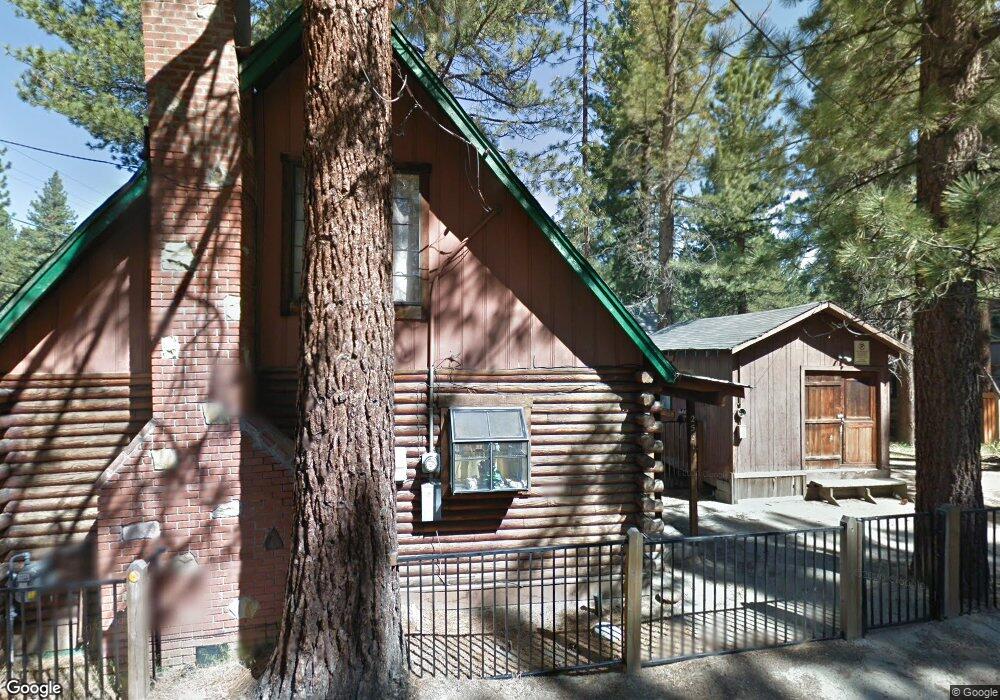
2561 Bertha Ave South Lake Tahoe, CA 96150
Estimated Value: $486,000 - $539,000
3
Beds
2
Baths
1,260
Sq Ft
$406/Sq Ft
Est. Value
About This Home
This home is located at 2561 Bertha Ave, South Lake Tahoe, CA 96150 and is currently estimated at $511,385, approximately $405 per square foot. 2561 Bertha Ave is a home located in El Dorado County with nearby schools including Tahoe Valley Elementary School, South Tahoe Middle School, and South Tahoe High School.
Ownership History
Date
Name
Owned For
Owner Type
Purchase Details
Closed on
Dec 6, 2024
Sold by
Cuturrufo Cristian E and Cuturrufo Judy A
Bought by
Cuturrufo Family Trust and Cuturrufo
Current Estimated Value
Purchase Details
Closed on
Jul 30, 2018
Sold by
Ramos Mario D and Ramos Viviana C
Bought by
Cuturrufo Cristian E and Cuturrufo Judy A
Purchase Details
Closed on
Jul 26, 1999
Sold by
Chase Teresa L
Bought by
Ramos Mario D and Ramos Vivianan C
Home Financials for this Owner
Home Financials are based on the most recent Mortgage that was taken out on this home.
Original Mortgage
$95,200
Interest Rate
7.64%
Purchase Details
Closed on
Aug 15, 1997
Sold by
Tanner George L and Tanner Carmel J
Bought by
Chase Teresa L
Create a Home Valuation Report for This Property
The Home Valuation Report is an in-depth analysis detailing your home's value as well as a comparison with similar homes in the area
Home Values in the Area
Average Home Value in this Area
Purchase History
| Date | Buyer | Sale Price | Title Company |
|---|---|---|---|
| Cuturrufo Family Trust | -- | None Listed On Document | |
| Cuturrufo Family Trust | -- | None Listed On Document | |
| Cuturrufo Cristian E | -- | None Available | |
| Ramos Mario D | $119,000 | Old Republic Title Company | |
| Chase Teresa L | $119,500 | Western Title Company |
Source: Public Records
Mortgage History
| Date | Status | Borrower | Loan Amount |
|---|---|---|---|
| Previous Owner | Ramos Mario D | $95,200 |
Source: Public Records
Tax History Compared to Growth
Tax History
| Year | Tax Paid | Tax Assessment Tax Assessment Total Assessment is a certain percentage of the fair market value that is determined by local assessors to be the total taxable value of land and additions on the property. | Land | Improvement |
|---|---|---|---|---|
| 2025 | $1,997 | $182,867 | $38,406 | $144,461 |
| 2024 | $1,997 | $179,282 | $37,653 | $141,629 |
| 2023 | $1,963 | $175,767 | $36,915 | $138,852 |
| 2022 | $1,944 | $172,322 | $36,192 | $136,130 |
| 2021 | $1,914 | $168,944 | $35,483 | $133,461 |
| 2020 | $1,887 | $167,213 | $35,120 | $132,093 |
| 2019 | $1,878 | $163,935 | $34,432 | $129,503 |
| 2018 | $1,837 | $160,721 | $33,757 | $126,964 |
| 2017 | $1,809 | $157,571 | $33,096 | $124,475 |
| 2016 | $1,773 | $154,483 | $32,448 | $122,035 |
| 2015 | $1,754 | $152,163 | $31,961 | $120,202 |
| 2014 | $1,610 | $149,185 | $31,336 | $117,849 |
Source: Public Records
Map
Nearby Homes
- 2561 Osborne Ave
- 2539 Knox Ave
- 1182 Reno Ave
- 2525 Knox Ave
- 2573 Rose Ave
- 1078 Reno Ave
- 2612 Alma Ave
- 2515 Rose Ave
- 2605 Elwood Ave
- 2560 Pinter Ave
- 2575 Fountain Ave
- 2613 Fountain Ave
- 1116 Lindberg Ave
- 2468 Rose Ave
- 2600 Fountain Ave
- 2605 Chris Ave
- 1029 Reno Ave
- 2684 Knox Ave
- 2634 Chris Ave
- 2687 Knox Ave
- 1129 Sierra Blvd
- 2567 Bertha Ave
- 2560 Bertha Ave
- 1125 Sierra Blvd
- 2571 Bertha Ave
- 1145 Sierra Blvd
- 2564 Knox Ave
- 1121 Sierra Blvd
- 2566 Bertha Ave
- 2573 Bertha Ave
- 2568 Knox Ave
- 2572 Bertha Ave
- 1124 Sierra Blvd
- 2540 Bertha Ave
- 2572 Knox Ave
- 2561 Osborne Ave Unit 1-5
- 2565 Osborne Ave
- 2575 Bertha Ave
- 2561 Knox Ave
- 2569 Osborne Ave