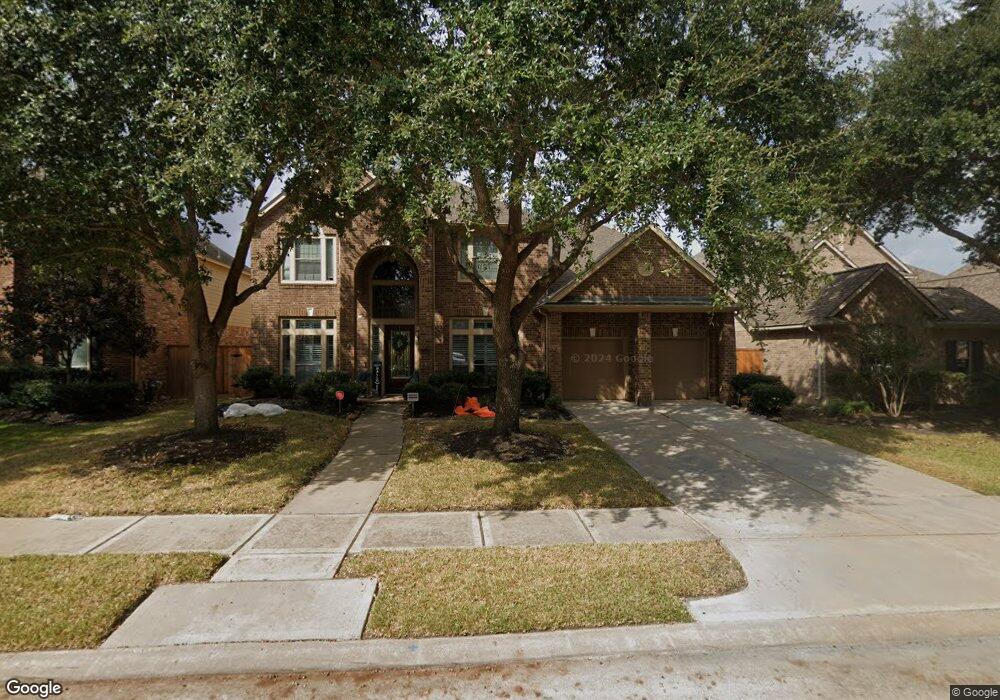
25618 Tower Side Ln Unit Ln Katy, TX 77494
Southwest Cinco Ranch NeighborhoodEstimated Value: $592,000 - $624,339
5
Beds
4
Baths
3,381
Sq Ft
$181/Sq Ft
Est. Value
About This Home
This home is located at 25618 Tower Side Ln Unit Ln, Katy, TX 77494 and is currently estimated at $610,335, approximately $180 per square foot. 25618 Tower Side Ln Unit Ln is a home located in Fort Bend County with nearby schools including Stanley C. Stanley Elementary School, Seven Lakes J H, and Seven Lakes High School.
Ownership History
Date
Name
Owned For
Owner Type
Purchase Details
Closed on
Jul 23, 2020
Sold by
Carvalho Maria
Bought by
Lam Shu Wing and Lam Eddie T
Current Estimated Value
Home Financials for this Owner
Home Financials are based on the most recent Mortgage that was taken out on this home.
Original Mortgage
$274,600
Outstanding Balance
$194,010
Interest Rate
3.1%
Mortgage Type
New Conventional
Estimated Equity
$416,325
Purchase Details
Closed on
Oct 15, 2015
Sold by
Carvalho Maria
Bought by
Carvalho Maria
Purchase Details
Closed on
Nov 17, 2008
Sold by
Perry Homes Llc
Bought by
Carvalho Andrew and Carvalho Maria
Home Financials for this Owner
Home Financials are based on the most recent Mortgage that was taken out on this home.
Original Mortgage
$240,510
Interest Rate
5.98%
Mortgage Type
Purchase Money Mortgage
Purchase Details
Closed on
Dec 1, 2006
Sold by
Terrabrook Cinco Ranch Southwest Llc
Bought by
Carvalho Maria
Create a Home Valuation Report for This Property
The Home Valuation Report is an in-depth analysis detailing your home's value as well as a comparison with similar homes in the area
Home Values in the Area
Average Home Value in this Area
Purchase History
| Date | Buyer | Sale Price | Title Company |
|---|---|---|---|
| Lam Shu Wing | -- | North Star Title Company | |
| Carvalho Maria | -- | None Available | |
| Carvalho Andrew | -- | Chicago Title | |
| Carvalho Maria | -- | -- |
Source: Public Records
Mortgage History
| Date | Status | Borrower | Loan Amount |
|---|---|---|---|
| Open | Lam Shu Wing | $274,600 | |
| Previous Owner | Carvalho Andrew | $240,510 |
Source: Public Records
Tax History
| Year | Tax Paid | Tax Assessment Tax Assessment Total Assessment is a certain percentage of the fair market value that is determined by local assessors to be the total taxable value of land and additions on the property. | Land | Improvement |
|---|---|---|---|---|
| 2025 | $10,323 | $571,129 | $94,510 | $529,773 |
| 2024 | $10,323 | $519,208 | -- | $544,434 |
| 2023 | $10,323 | $458,656 | -- | $474,948 |
| 2022 | $10,247 | $416,960 | $21,970 | $394,990 |
| 2021 | $10,555 | $379,050 | $72,700 | $306,350 |
| 2020 | $10,934 | $384,740 | $66,150 | $318,590 |
| 2019 | $10,753 | $359,560 | $66,150 | $293,410 |
| 2018 | $11,020 | $364,210 | $66,150 | $298,060 |
| 2017 | $11,500 | $373,920 | $66,150 | $307,770 |
| 2016 | $12,139 | $394,690 | $66,150 | $328,540 |
| 2015 | $6,657 | $350,850 | $66,150 | $284,700 |
| 2014 | $6,190 | $318,950 | $66,150 | $252,800 |
Source: Public Records
Map
Nearby Homes
- 9914 Slover Creek Ln
- 25403 Hall Meadow Ln
- 25703 Pierrmont Ct
- 25707 Pierrmont Ct
- 9727 Chicory Chase Ct
- 26010 Sebey Ridge Ln
- 26014 Sebey Ridge Ln
- 25210 Doves Gate Ct
- 9427 Hawks Harbor Ct
- 10014 Touhy Lake Dr
- 6023 Gatewood Manor Dr
- 9407 Herons Grove Ln
- 27906 Barker Hollow Dr
- 6414 Cedardale Falls Dr
- 25215 Springwood Lake Dr
- 26102 Salt Creek Ln
- 6026 Emberwood Falls Dr
- 6006 Emberwood Falls Dr
- 9623 Cherry Quartz Ct
- 6026 Starbrook Creek Dr
- 25618 Tower Side Ln
- 25622 Tower Side Ln
- 25615 Durango Falls Ln
- 25626 Tower Side Ln
- 25611 Durango Falls Ln
- 25610 Tower Side Ln
- 25619 Durango Falls Ln
- 25619 Tower Unit Lane
- 25619 Tower Unit Ln
- 25615 Tower Side Ln
- 25623 Tower Side Ln
- 25623 Durango Falls Ln
- 25611 Tower Side Ln
- 25630 Tower Side Ln
- 25607 Durango Falls Ln
- 25627 Tower Side Ln
- 25627 Tower Side Ln Unit Lane
- 25627 Tower Unit Lane
- 25627 Durango Falls Ln
- 25631 Tower Side Ln
Your Personal Tour Guide
Ask me questions while you tour the home.