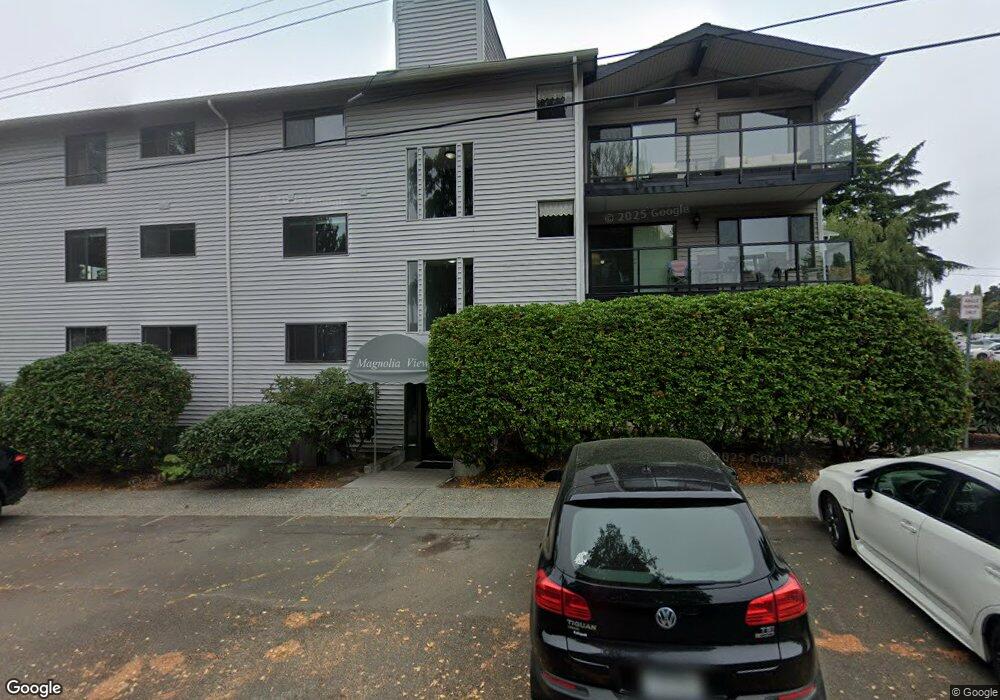
2562 Thorndyke Ave W Unit 43 Seattle, WA 98199
Southeast Magnolia NeighborhoodEstimated Value: $359,000 - $577,000
2
Beds
2
Baths
1,010
Sq Ft
$469/Sq Ft
Est. Value
About This Home
This home is located at 2562 Thorndyke Ave W Unit 43, Seattle, WA 98199 and is currently estimated at $474,151, approximately $469 per square foot. 2562 Thorndyke Ave W Unit 43 is a home located in King County with nearby schools including Mcclure Middle School and Ballard High School.
Ownership History
Date
Name
Owned For
Owner Type
Purchase Details
Closed on
May 16, 2007
Sold by
Slovic Lauren M
Bought by
Lever Ii Harley W
Current Estimated Value
Home Financials for this Owner
Home Financials are based on the most recent Mortgage that was taken out on this home.
Original Mortgage
$30,500
Interest Rate
5.81%
Mortgage Type
Stand Alone Second
Purchase Details
Closed on
Dec 27, 2001
Sold by
Anderson Richard B and Anderson Leanna M
Bought by
Slovic Lauren M
Home Financials for this Owner
Home Financials are based on the most recent Mortgage that was taken out on this home.
Original Mortgage
$165,800
Interest Rate
6.51%
Purchase Details
Closed on
Oct 24, 1996
Sold by
Anderson Kimiko J
Bought by
Anderson Montgomery R
Create a Home Valuation Report for This Property
The Home Valuation Report is an in-depth analysis detailing your home's value as well as a comparison with similar homes in the area
Home Values in the Area
Average Home Value in this Area
Purchase History
| Date | Buyer | Sale Price | Title Company |
|---|---|---|---|
| Lever Ii Harley W | $308,000 | Transnation Ti | |
| Slovic Lauren M | $184,000 | Old Republic Title Ltd | |
| Anderson Montgomery R | -- | Stewart Title Company |
Source: Public Records
Mortgage History
| Date | Status | Borrower | Loan Amount |
|---|---|---|---|
| Closed | Lever Ii Harley W | $30,500 | |
| Open | Lever Ii Harley W | $246,400 | |
| Previous Owner | Slovic Lauren M | $165,800 |
Source: Public Records
Tax History Compared to Growth
Tax History
| Year | Tax Paid | Tax Assessment Tax Assessment Total Assessment is a certain percentage of the fair market value that is determined by local assessors to be the total taxable value of land and additions on the property. | Land | Improvement |
|---|---|---|---|---|
| 2024 | $3,456 | $357,000 | $150,900 | $206,100 |
| 2023 | $3,044 | $360,000 | $150,900 | $209,100 |
| 2022 | $3,447 | $356,000 | $139,300 | $216,700 |
| 2021 | $3,460 | $374,000 | $139,300 | $234,700 |
| 2020 | $3,450 | $357,000 | $139,300 | $217,700 |
| 2018 | $3,083 | $354,000 | $127,700 | $226,300 |
| 2017 | $2,561 | $311,000 | $96,700 | $214,300 |
| 2016 | $2,474 | $266,000 | $78,200 | $187,800 |
| 2015 | $2,626 | $251,000 | $78,200 | $172,800 |
| 2014 | -- | $274,000 | $69,600 | $204,400 |
| 2013 | -- | $228,000 | $65,800 | $162,200 |
Source: Public Records
Map
Nearby Homes
- 2562 Thorndyke Ave W Unit 104
- 2605 22nd Ave W Unit D
- 2551 Thorndyke Ave W Unit 203
- 2218 W Raye St
- 2636 22nd Ave W Unit 203
- 2636 22nd Ave W Unit 101
- 2635 22nd Ave W Unit B
- 2308 W Smith St
- 2612 25th Ave W
- 2571 26th Ave W
- 2312 W Crockett St
- 2301 W Crockett St
- 3045 20th Ave W Unit 108
- 3045 20th Ave W Unit 210
- 3045 20th Ave W Unit 208
- 2100 Thorndyke Ave W Unit 101
- 2116 W Dravus St
- 2630 W Lynn St
- 2561 28th Ave W
- 3028 26th Ave W
- 2562 Thorndyke Ave W Unit 101
- 2562 Thorndyke Ave W Unit 406
- 2562 Thorndyke Ave W Unit 302
- 2562 Thorndyke Ave W Unit 304
- 2562 Thorndyke Ave W Unit 301
- 2562 Thorndyke Ave W Unit 403
- 2562 Thorndyke Ave W Unit 205
- 2562 Thorndyke Ave W Unit 306
- 2562 Thorndyke Ave W Unit 31
- 2562 Thorndyke Ave W Unit 34
- 2562 Thorndyke Ave W Unit 24
- 2562 Thorndyke Ave W Unit 42
- 2562 Thorndyke Ave W Unit 25
- 2562 Thorndyke Ave W Unit 35
- 2562 Thorndyke Ave W Unit 33
- 2562 Thorndyke Ave W Unit 22
- 2562 Thorndyke Ave W Unit 45
- 2562 Thorndyke Ave W Unit 41
- 2562 Thorndyke Ave W Unit 21
- 2562 Thorndyke Ave W Unit 32