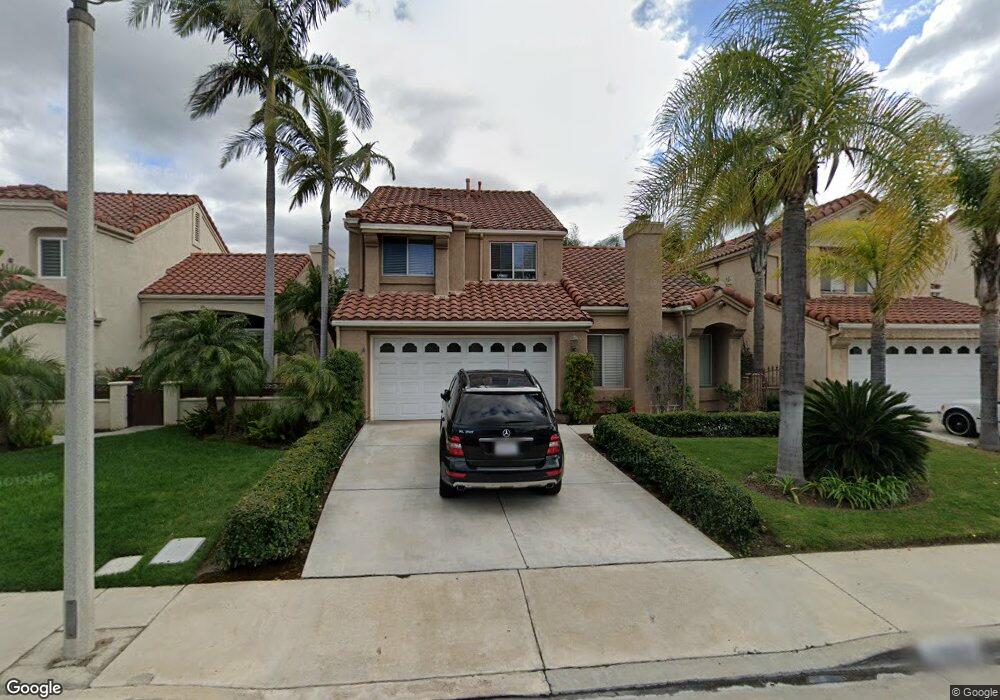
25626 Salerno Way Yorba Linda, CA 92887
Estimated Value: $1,101,759 - $1,182,000
4
Beds
3
Baths
1,895
Sq Ft
$612/Sq Ft
Est. Value
About This Home
This home is located at 25626 Salerno Way, Yorba Linda, CA 92887 and is currently estimated at $1,159,690, approximately $611 per square foot. 25626 Salerno Way is a home located in Orange County with nearby schools including Bryant Ranch Elementary School, Travis Ranch Middle School, and Yorba Linda High School.
Ownership History
Date
Name
Owned For
Owner Type
Purchase Details
Closed on
Jan 24, 2002
Sold by
Langpap Marty and Young Shannon
Bought by
Langpap Martin and Langpap Shannon
Current Estimated Value
Home Financials for this Owner
Home Financials are based on the most recent Mortgage that was taken out on this home.
Original Mortgage
$247,000
Outstanding Balance
$102,925
Interest Rate
7.17%
Estimated Equity
$1,056,765
Purchase Details
Closed on
Oct 5, 2000
Sold by
Yu Chang Yu Chang and Chang Ruey Chang
Bought by
Langpap Marty and Young Shannon
Home Financials for this Owner
Home Financials are based on the most recent Mortgage that was taken out on this home.
Original Mortgage
$243,800
Interest Rate
7.88%
Purchase Details
Closed on
Dec 14, 1993
Sold by
Phelps David and Phelps Angelita
Bought by
Yu Chang Yu and Lu Ruey Chang
Home Financials for this Owner
Home Financials are based on the most recent Mortgage that was taken out on this home.
Original Mortgage
$185,000
Interest Rate
7.09%
Create a Home Valuation Report for This Property
The Home Valuation Report is an in-depth analysis detailing your home's value as well as a comparison with similar homes in the area
Home Values in the Area
Average Home Value in this Area
Purchase History
| Date | Buyer | Sale Price | Title Company |
|---|---|---|---|
| Langpap Martin | -- | First American Title Co | |
| Langpap Marty | $305,000 | First American Title Ins Co | |
| Yu Chang Yu | $235,000 | Continental Lawyers Title Co |
Source: Public Records
Mortgage History
| Date | Status | Borrower | Loan Amount |
|---|---|---|---|
| Open | Langpap Martin | $247,000 | |
| Closed | Langpap Marty | $243,800 | |
| Previous Owner | Yu Chang Yu | $185,000 |
Source: Public Records
Tax History Compared to Growth
Tax History
| Year | Tax Paid | Tax Assessment Tax Assessment Total Assessment is a certain percentage of the fair market value that is determined by local assessors to be the total taxable value of land and additions on the property. | Land | Improvement |
|---|---|---|---|---|
| 2025 | $5,424 | $459,275 | $254,025 | $205,250 |
| 2024 | $5,424 | $450,270 | $249,044 | $201,226 |
| 2023 | $5,275 | $441,442 | $244,161 | $197,281 |
| 2022 | $5,195 | $432,787 | $239,374 | $193,413 |
| 2021 | $5,097 | $424,301 | $234,680 | $189,621 |
| 2020 | $5,032 | $419,951 | $232,274 | $187,677 |
| 2019 | $4,893 | $411,717 | $227,719 | $183,998 |
| 2018 | $4,886 | $403,645 | $223,254 | $180,391 |
| 2017 | $5,051 | $395,731 | $218,877 | $176,854 |
| 2016 | $4,675 | $387,972 | $214,585 | $173,387 |
| 2015 | $4,792 | $382,145 | $211,362 | $170,783 |
| 2014 | $4,693 | $374,660 | $207,222 | $167,438 |
Source: Public Records
Map
Nearby Homes
- 25633 Corsica Way
- 5917 San Remo Way
- 25540 Aragon Way
- 25511 Palermo Way
- 0 Meadow Land Dr
- 27870 Tamara Dr
- 23964 Old Pomegranate Rd
- 5570 Meadow Lake Ln
- 5527 Patricia Way
- 23985 Nicole Way Unit 31
- 28685 Morning Dew Way
- 24670 Paseo de Toronto
- 5425 Castle Bend Way
- 27170 Big Horn Mountain Way
- 27025 Glaramara Ln
- 5420 Los Monteros
- 27055 Big Horn Mountain Way
- 23556 Cambridge Rd Unit 327
- 23502 Cambridge Rd Unit 306
- 23482 Cambridge Rd Unit 294
- 25624 Salerno Way
- 25630 Salerno Way
- 25622 Salerno Way
- 25607 Corsica Way
- 25609 Corsica Way
- 25605 Corsica Way
- 25632 Salerno Way
- 25611 Corsica Way
- 25620 Salerno Way
- 25628 Aragon Way
- 25631 Salerno Way
- 25629 Salerno Way
- 25633 Salerno Way
- 25627 Salerno Way
- 25613 Corsica Way
- 25624 Aragon Way
- 25635 Salerno Way
- 25634 Salerno Way
- 25625 Salerno Way
- 25637 Salerno Way