Estimated Value: $1,151,000 - $1,309,491
5
Beds
4
Baths
4,300
Sq Ft
$287/Sq Ft
Est. Value
About This Home
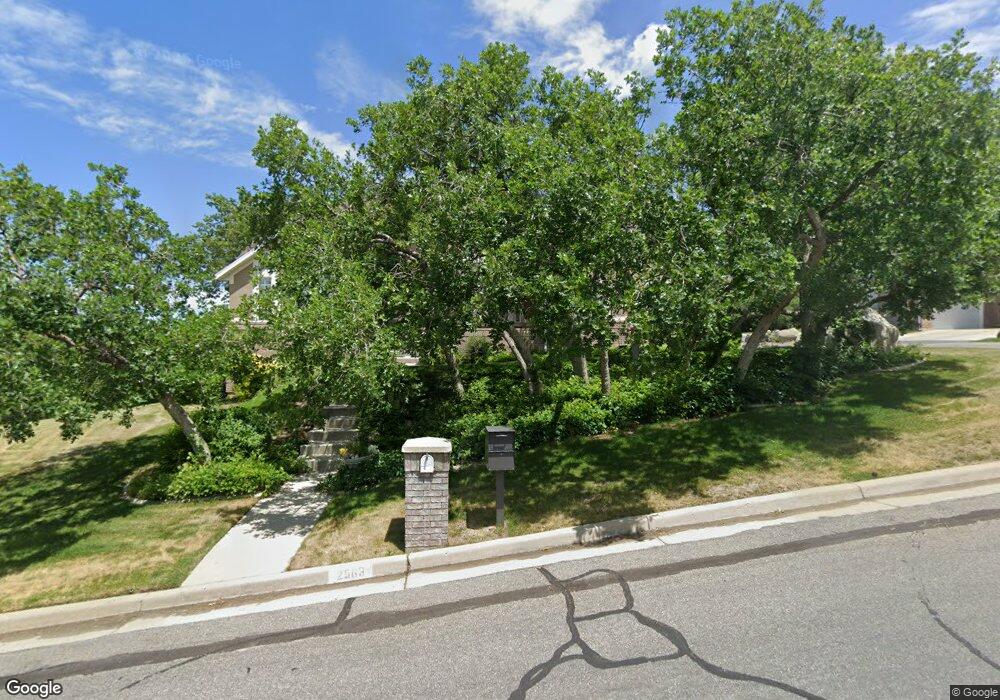
This home is located at 2563 E Hidden Canyon Ln, Sandy, UT 84092 and is currently estimated at $1,233,123, approximately $286 per square foot. 2563 E Hidden Canyon Ln is a home located in Salt Lake County with nearby schools including Bell Canyon Montessori School.
Ownership History
Date
Name
Owned For
Owner Type
Purchase Details
Closed on
Apr 16, 2008
Sold by
Lusienski Phil and Lusienski Sharon
Bought by
Lusienski Phil D and Lusienski Sharon
Current Estimated Value
Home Financials for this Owner
Home Financials are based on the most recent Mortgage that was taken out on this home.
Original Mortgage
$385,000
Outstanding Balance
$238,646
Interest Rate
5.99%
Mortgage Type
New Conventional
Estimated Equity
$994,477
Purchase Details
Closed on
Nov 22, 2002
Sold by
Olsen David J and Olsen Jill M
Bought by
Olsen David J and Olsen Jill M
Home Financials for this Owner
Home Financials are based on the most recent Mortgage that was taken out on this home.
Original Mortgage
$372,300
Interest Rate
5.5%
Purchase Details
Closed on
Apr 30, 2002
Sold by
Olsen David J and Olsen Jill
Bought by
Olsen David J and Olsen Jill M
Purchase Details
Closed on
Jan 26, 1994
Sold by
Olsen Jill
Bought by
Olsen David J and Olsen Jill
Home Financials for this Owner
Home Financials are based on the most recent Mortgage that was taken out on this home.
Original Mortgage
$203,150
Interest Rate
7.21%
Create a Home Valuation Report for This Property
The Home Valuation Report is an in-depth analysis detailing your home's value as well as a comparison with similar homes in the area
Home Values in the Area
Average Home Value in this Area
Purchase History
| Date | Buyer | Sale Price | Title Company |
|---|---|---|---|
| Lusienski Phil D | -- | Meridian Title | |
| Lusienski Phil | -- | Meridian Title | |
| Olsen David J | -- | Eagle Point Title | |
| Olsen David J | -- | -- | |
| Olsen David J | -- | -- | |
| Olsen Jill | -- | -- |
Source: Public Records
Mortgage History
| Date | Status | Borrower | Loan Amount |
|---|---|---|---|
| Open | Lusienski Phil D | $385,000 | |
| Previous Owner | Olsen David J | $372,300 | |
| Previous Owner | Olsen Jill | $203,150 |
Source: Public Records
Tax History
| Year | Tax Paid | Tax Assessment Tax Assessment Total Assessment is a certain percentage of the fair market value that is determined by local assessors to be the total taxable value of land and additions on the property. | Land | Improvement |
|---|---|---|---|---|
| 2025 | $513 | $1,101,600 | $402,300 | $699,300 |
| 2024 | $513 | $939,300 | $368,000 | $571,300 |
| 2023 | $513 | $841,700 | $352,600 | $489,100 |
| 2022 | $4,769 | $880,800 | $345,600 | $535,200 |
| 2021 | $4,593 | $722,400 | $281,100 | $441,300 |
| 2020 | $4,507 | $669,400 | $281,100 | $388,300 |
| 2019 | $4,402 | $638,100 | $266,700 | $371,400 |
| 2018 | $4,036 | $611,800 | $266,700 | $345,100 |
| 2017 | $3,977 | $577,100 | $266,700 | $310,400 |
| 2016 | $4,122 | $578,700 | $266,700 | $312,000 |
| 2015 | $4,098 | $533,300 | $232,000 | $301,300 |
| 2014 | $3,869 | $494,700 | $218,700 | $276,000 |
Source: Public Records
Map
Nearby Homes
- 11683 S 2460 E
- 11551 S Woodhampton Dr
- 2403 E Bear Hills Cir
- 2373 E Bear Hills Cir
- 2232 E Lone Eagle Ln
- 11446 S 2320 E
- 35 E Lone Hollow Dr
- 18 Snow Forest Ln
- 3 Snow Forest Cove Unit 1039
- 11779 S Windcroft Ct
- 2192 E High Mesa Dr
- 1 Cross Hill Ln
- 12056 S Cortina Crest Dr
- 2122 Wasatch Blvd
- 89 Lone Hollow Dr Unit 1026
- 2234 E Willow Brook Way
- 9 Windsong
- 15 Bentwood Ln S Unit 1117
- 5 Bent Hollow Ln
- 11 Bent Hollow Ln Unit 1141
- 2563 Hidden Canyon Ln
- 2583 Hidden Canyon Ln
- 2567 E Hidden Canyon Ln
- 11793 S Hidden Brook Blvd
- 11793 Hidden Brook Blvd
- 2571 Hidden Canyon Ln
- 2599 E Hidden Canyon Ln
- 2599 Hidden Canyon Ln
- 11778 Hidden Brook Blvd
- 11760 Hidden Brook Blvd
- 2588 Hidden Canyon Ln
- 11811 Hidden Brook Blvd
- 11811 S Hidden Brook Blvd
- 11802 S Hidden Brook Blvd
- 11802 Hidden Brook Blvd
- 2615 Hidden Canyon Ln
- 2615 E Hidden Canyon Ln
- 11734 Cassowary Dr
- 11722 Cassowary Dr
- 2640 Cassowary Dr
Your Personal Tour Guide
Ask me questions while you tour the home.