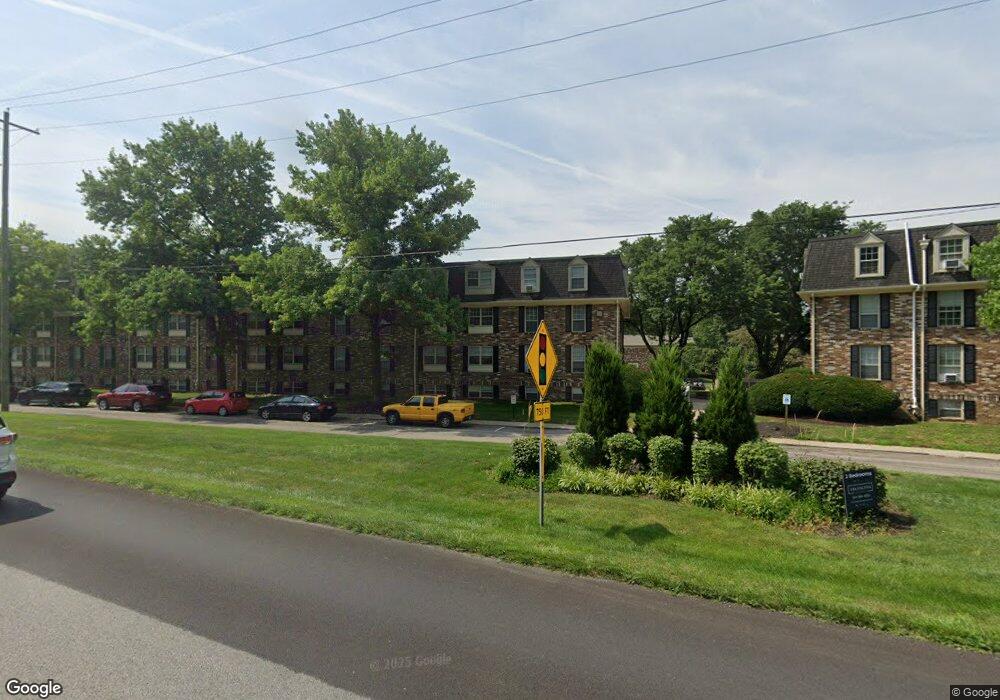
2563 Olde Hill Ct S Unit B2563 Columbus, OH 43221
Scioto Trace NeighborhoodEstimated Value: $222,000 - $242,000
3
Beds
2
Baths
1,109
Sq Ft
$210/Sq Ft
Est. Value
About This Home
This home is located at 2563 Olde Hill Ct S Unit B2563, Columbus, OH 43221 and is currently estimated at $232,538, approximately $209 per square foot. 2563 Olde Hill Ct S Unit B2563 is a home located in Franklin County with nearby schools including Tremont Elementary School, Jones Middle School, and Upper Arlington High School.
Ownership History
Date
Name
Owned For
Owner Type
Purchase Details
Closed on
Dec 8, 2020
Sold by
Mosca Rachel A and Balduf Rachel
Bought by
Schroeder Luke J and Ng Lily
Current Estimated Value
Home Financials for this Owner
Home Financials are based on the most recent Mortgage that was taken out on this home.
Original Mortgage
$146,900
Outstanding Balance
$131,018
Interest Rate
2.8%
Mortgage Type
New Conventional
Estimated Equity
$101,520
Purchase Details
Closed on
Aug 17, 2007
Sold by
Scioto Riverpark Llc
Bought by
Mosca Rachel A
Home Financials for this Owner
Home Financials are based on the most recent Mortgage that was taken out on this home.
Original Mortgage
$100,000
Interest Rate
6.72%
Mortgage Type
Purchase Money Mortgage
Create a Home Valuation Report for This Property
The Home Valuation Report is an in-depth analysis detailing your home's value as well as a comparison with similar homes in the area
Home Values in the Area
Average Home Value in this Area
Purchase History
| Date | Buyer | Sale Price | Title Company |
|---|---|---|---|
| Schroeder Luke J | $166,900 | Stewart Title | |
| Mosca Rachel A | $136,000 | Talon Group |
Source: Public Records
Mortgage History
| Date | Status | Borrower | Loan Amount |
|---|---|---|---|
| Open | Schroeder Luke J | $146,900 | |
| Previous Owner | Mosca Rachel A | $100,000 |
Source: Public Records
Tax History Compared to Growth
Tax History
| Year | Tax Paid | Tax Assessment Tax Assessment Total Assessment is a certain percentage of the fair market value that is determined by local assessors to be the total taxable value of land and additions on the property. | Land | Improvement |
|---|---|---|---|---|
| 2024 | $4,838 | $66,540 | $12,780 | $53,760 |
| 2023 | $4,284 | $66,535 | $12,775 | $53,760 |
| 2022 | $4,103 | $51,590 | $16,800 | $34,790 |
| 2021 | $3,658 | $51,590 | $16,800 | $34,790 |
| 2020 | $3,723 | $51,590 | $16,800 | $34,790 |
| 2019 | $3,560 | $42,980 | $14,000 | $28,980 |
| 2018 | $1,774 | $42,980 | $14,000 | $28,980 |
| 2017 | $3,538 | $42,980 | $14,000 | $28,980 |
| 2016 | $3,063 | $37,840 | $9,310 | $28,530 |
| 2015 | $1,531 | $37,840 | $9,310 | $28,530 |
| 2014 | $2,852 | $37,840 | $9,310 | $28,530 |
| 2013 | $1,661 | $42,000 | $10,325 | $31,675 |
Source: Public Records
Map
Nearby Homes
- 2560 Scioto View Ln Unit 2560
- 2571 Scioto View Ln Unit K
- 2583 Olde Hill Ct N Unit C2583
- 2594 Scioto View Ln Unit 2594
- 2833 Katmai Dr
- 2841 Katmai Dr
- 2835 Katmai Dr
- 2851 Katmai Dr
- 2806 Kobuk Dr
- 2812 Kobuk Dr
- 2832 Kobuk Dr
- 2528 Onandaga Dr
- 2808 Kobuk Dr
- 2872 Kobuk Dr
- 2878 Kobuk Dr
- 2374 Quarry Trails Dr
- 2879 Kobuk Dr Unit 304
- 2879 Kobuk Dr Unit 202
- 2342 Quarry Trails Dr
- 2342 Quarry Trails Dr
- 2565 Olde Hill Ct S
- 2563 Olde Hill Ct S Unit B
- 2567 Olde Hill Ct S Unit B2567
- 2567 Olde Hill Ct S Unit B
- 2569 Olde Hill Ct S Unit B2569
- 2561 Olde Hill Ct S Unit A2561
- 2561 Olde Hill Ct S Unit A
- 2559 Olde Hill Ct S Unit A2559
- 2559 Olde Hill Ct S Unit A
- 2571 Olde Hill Ct S Unit B2571
- 2552 Scioto View Ln Unit F2552
- 2552 Scioto View Ln Unit F
- 2554 Scioto View Ln Unit F2554
- 2554 Scioto View Ln Unit F
- 2573 Olde Hill Ct S Unit B2573
- 2573 Olde Hill Ct S Unit B
- 2550 Scioto View Ln Unit E2550
- 2558 Scioto View Ln Unit F2558
- 2558 Scioto View Ln Unit F
- 2548 Scioto View Ln Unit 2548