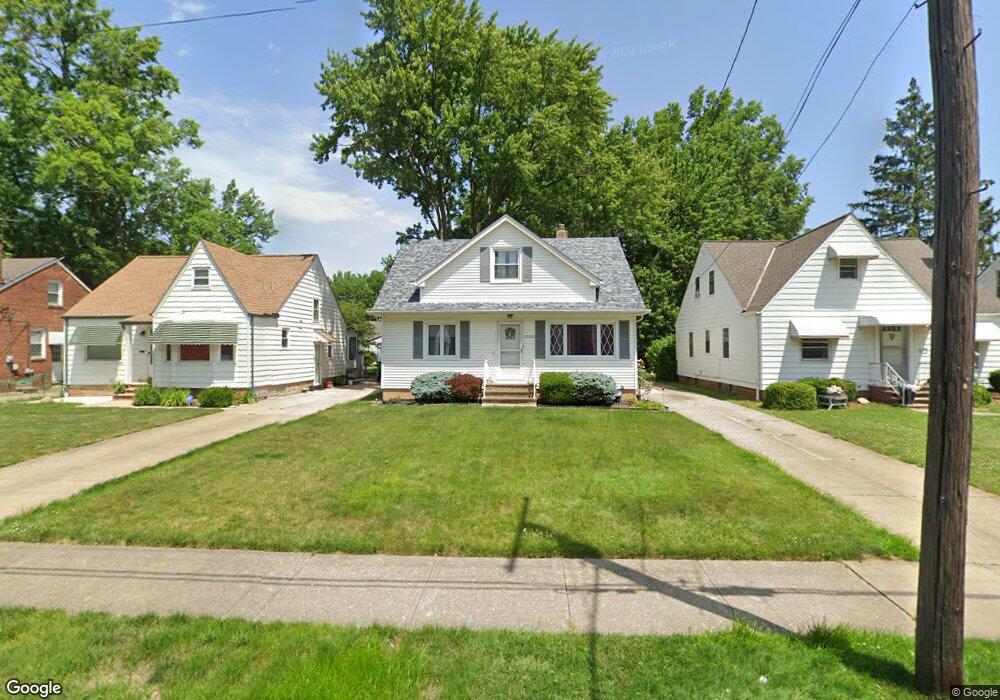
25631 Farringdon Ave Euclid, OH 44132
Estimated Value: $162,000 - $204,000
4
Beds
2
Baths
1,530
Sq Ft
$117/Sq Ft
Est. Value
About This Home
This home is located at 25631 Farringdon Ave, Euclid, OH 44132 and is currently estimated at $179,264, approximately $117 per square foot. 25631 Farringdon Ave is a home located in Cuyahoga County with nearby schools including Shoreview Elementary School, Euclid High School, and Ss. Robert & William Catholic School.
Ownership History
Date
Name
Owned For
Owner Type
Purchase Details
Closed on
Jul 17, 2006
Sold by
Borthwick Donald N
Bought by
Jones George K and Jones Sandra J
Current Estimated Value
Home Financials for this Owner
Home Financials are based on the most recent Mortgage that was taken out on this home.
Original Mortgage
$102,400
Outstanding Balance
$62,782
Interest Rate
7.25%
Mortgage Type
Purchase Money Mortgage
Estimated Equity
$116,482
Purchase Details
Closed on
Dec 20, 2002
Sold by
Borthwick Donald N and Borthwick Eleanor A
Bought by
Borthwick Eleanor A
Purchase Details
Closed on
Apr 27, 1998
Sold by
Borthwick Eleanor A
Bought by
Borthwick Eleanor A and Borthwich Donald N
Purchase Details
Closed on
May 27, 1977
Sold by
Borthwick Donald N and Borthwick Eleanor
Bought by
Borthwick Donald N
Purchase Details
Closed on
Jan 1, 1975
Bought by
Borthwick Donald N and Borthwick Eleanor
Create a Home Valuation Report for This Property
The Home Valuation Report is an in-depth analysis detailing your home's value as well as a comparison with similar homes in the area
Home Values in the Area
Average Home Value in this Area
Purchase History
| Date | Buyer | Sale Price | Title Company |
|---|---|---|---|
| Jones George K | $128,000 | Barristers Title Agency | |
| Borthwick Eleanor A | -- | -- | |
| Borthwick Eleanor A | -- | Midland Title Security Inc | |
| Borthwick Eleanor A | -- | Midland Title Security Inc | |
| Borthwick Donald N | -- | -- | |
| Borthwick Donald N | -- | -- |
Source: Public Records
Mortgage History
| Date | Status | Borrower | Loan Amount |
|---|---|---|---|
| Open | Jones George K | $102,400 |
Source: Public Records
Tax History Compared to Growth
Tax History
| Year | Tax Paid | Tax Assessment Tax Assessment Total Assessment is a certain percentage of the fair market value that is determined by local assessors to be the total taxable value of land and additions on the property. | Land | Improvement |
|---|---|---|---|---|
| 2024 | $3,699 | $54,075 | $9,030 | $45,045 |
| 2023 | $3,206 | $37,240 | $6,860 | $30,380 |
| 2022 | $3,133 | $37,240 | $6,860 | $30,380 |
| 2021 | $3,492 | $37,240 | $6,860 | $30,380 |
| 2020 | $3,310 | $32,100 | $5,920 | $26,180 |
| 2019 | $2,977 | $91,700 | $16,900 | $74,800 |
| 2018 | $2,994 | $32,100 | $5,920 | $26,180 |
| 2017 | $3,235 | $28,880 | $4,900 | $23,980 |
| 2016 | $3,242 | $28,880 | $4,900 | $23,980 |
| 2015 | $2,950 | $28,880 | $4,900 | $23,980 |
| 2014 | $2,950 | $28,880 | $4,900 | $23,980 |
Source: Public Records
Map
Nearby Homes
- 25671 Farringdon Ave
- 25750 Drakefield Ave
- 25450 Farringdon Ave
- 25401 Farringdon Ave
- 25700 Briardale Ave
- 25650 Shoreview Ave
- 640 E 261st St
- 25390 Briardale Ave
- 635 E 261st St
- 26351 Farringdon Ave
- 26171 Shoreview Ave
- 26430 Drakefield Ave
- 26471 Farringdon Ave
- 24891 Zeman Ave
- 24850 Zeman Ave
- 26230 Oriole Ave
- 26471 Shoreview Ave
- 24850 Shoreview Ave
- 754 E 256th St
- 712 E 266th St
- 25651 Farringdon Ave
- 25601 Farringdon Ave
- 25551 Farringdon Ave
- 25701 Farringdon Ave
- 25531 Farringdon Ave
- 25630 Zeman Ave
- 25650 Zeman Ave
- 25600 Zeman Ave
- 25670 Zeman Ave
- 25550 Zeman Ave
- 25521 Farringdon Ave
- 25700 Zeman Ave
- 25530 Zeman Ave
- 25630 Farringdon Ave
- 25600 Farringdon Ave
- 25650 Farringdon Ave
- 25550 Farringdon Ave
- 25670 Farringdon Ave
- 25751 Farringdon Ave
- 25501 Farringdon Ave