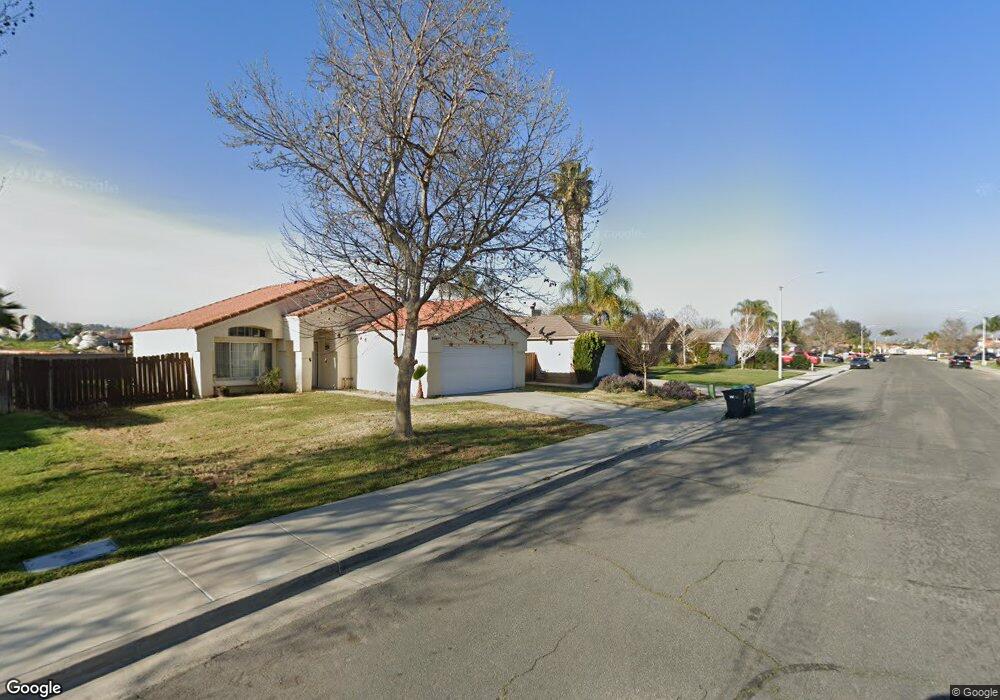
25633 Dorval Ct Menifee, CA 92584
Estimated Value: $490,378 - $522,000
2
Beds
2
Baths
1,272
Sq Ft
$401/Sq Ft
Est. Value
About This Home
This home is located at 25633 Dorval Ct, Menifee, CA 92584 and is currently estimated at $510,095, approximately $401 per square foot. 25633 Dorval Ct is a home located in Riverside County with nearby schools including Taawila Elementary School, Menifee Valley Middle School, and Pinacate Middle School.
Ownership History
Date
Name
Owned For
Owner Type
Purchase Details
Closed on
Apr 25, 2013
Sold by
Gaffney Michele L and Call Michele L
Bought by
Gaffney Michele L and Gaffney Gregory J
Current Estimated Value
Home Financials for this Owner
Home Financials are based on the most recent Mortgage that was taken out on this home.
Original Mortgage
$105,800
Outstanding Balance
$74,917
Interest Rate
3.54%
Mortgage Type
New Conventional
Estimated Equity
$435,178
Purchase Details
Closed on
Jan 25, 2001
Sold by
Call Michele L
Bought by
Call Michele L
Home Financials for this Owner
Home Financials are based on the most recent Mortgage that was taken out on this home.
Original Mortgage
$107,200
Interest Rate
7.13%
Purchase Details
Closed on
Sep 24, 1998
Sold by
Call John
Bought by
Call Michele L
Home Financials for this Owner
Home Financials are based on the most recent Mortgage that was taken out on this home.
Original Mortgage
$82,400
Interest Rate
8.12%
Create a Home Valuation Report for This Property
The Home Valuation Report is an in-depth analysis detailing your home's value as well as a comparison with similar homes in the area
Home Values in the Area
Average Home Value in this Area
Purchase History
| Date | Buyer | Sale Price | Title Company |
|---|---|---|---|
| Gaffney Michele L | -- | First American Equity Loan S | |
| Call Michele L | -- | Commonwealth Land Title Co | |
| Call Michele L | -- | Chicago Title Co | |
| Call Michele L | $110,000 | Chicago Title Co |
Source: Public Records
Mortgage History
| Date | Status | Borrower | Loan Amount |
|---|---|---|---|
| Open | Gaffney Michele L | $105,800 | |
| Closed | Call Michele L | $107,200 | |
| Previous Owner | Call Michele L | $82,400 | |
| Closed | Call Michele L | $21,950 |
Source: Public Records
Tax History Compared to Growth
Tax History
| Year | Tax Paid | Tax Assessment Tax Assessment Total Assessment is a certain percentage of the fair market value that is determined by local assessors to be the total taxable value of land and additions on the property. | Land | Improvement |
|---|---|---|---|---|
| 2025 | $2,075 | $173,829 | $54,853 | $118,976 |
| 2023 | $2,075 | $167,081 | $52,724 | $114,357 |
| 2022 | $2,060 | $163,806 | $51,691 | $112,115 |
| 2021 | $2,025 | $160,595 | $50,678 | $109,917 |
| 2020 | $1,993 | $158,949 | $50,159 | $108,790 |
| 2019 | $1,954 | $155,833 | $49,176 | $106,657 |
| 2018 | $1,875 | $152,778 | $48,213 | $104,565 |
| 2017 | $1,844 | $149,783 | $47,268 | $102,515 |
| 2016 | $1,778 | $146,847 | $46,342 | $100,505 |
| 2015 | $1,752 | $144,644 | $45,647 | $98,997 |
| 2014 | $1,707 | $141,811 | $44,753 | $97,058 |
Source: Public Records
Map
Nearby Homes
- 25707 Pelion Rd
- 25561 Dorval Ct
- 29877 Gifhorn Ct
- 29773 Gifhorn Rd
- 25382 Rocking Horse Ct
- 25349 Rocking Horse Ct
- 25908 Caravan Ct
- 25324 Country Fair Dr
- 25783 Roundup Cir
- 26041 San Quintin Rd
- 25266 Shady Creek Cir
- 25315 Lone Acres Rd
- 26091 San Quintin Rd
- 29822 Cool Meadow Dr
- 29567 Cool Meadow Dr
- 29514 Wagon Creek Ln
- 29867 Cool Meadow Dr
- 30459 Cowboy Ln
- 29370 Murrieta Rd
- 1 Vía Cabana
- 25621 Dorval Ct
- 25647 Dorval Ct
- 25609 Dorval Ct
- 25657 Dorval Ct
- 25634 Dorval Ct
- 25622 Dorval Ct
- 25646 Dorval Ct
- 25610 Dorval Ct
- 25669 Dorval Ct
- 25597 Dorval Ct
- 25658 Dorval Ct
- 25598 Dorval Ct
- 25585 Dorval Ct
- 25681 Dorval Ct
- 25670 Dorval Ct
- 25635 Pelion Rd
- 25611 Pelion Rd
- 25647 Pelion Rd
- 25586 Dorval Ct
- 25599 Pelion Rd