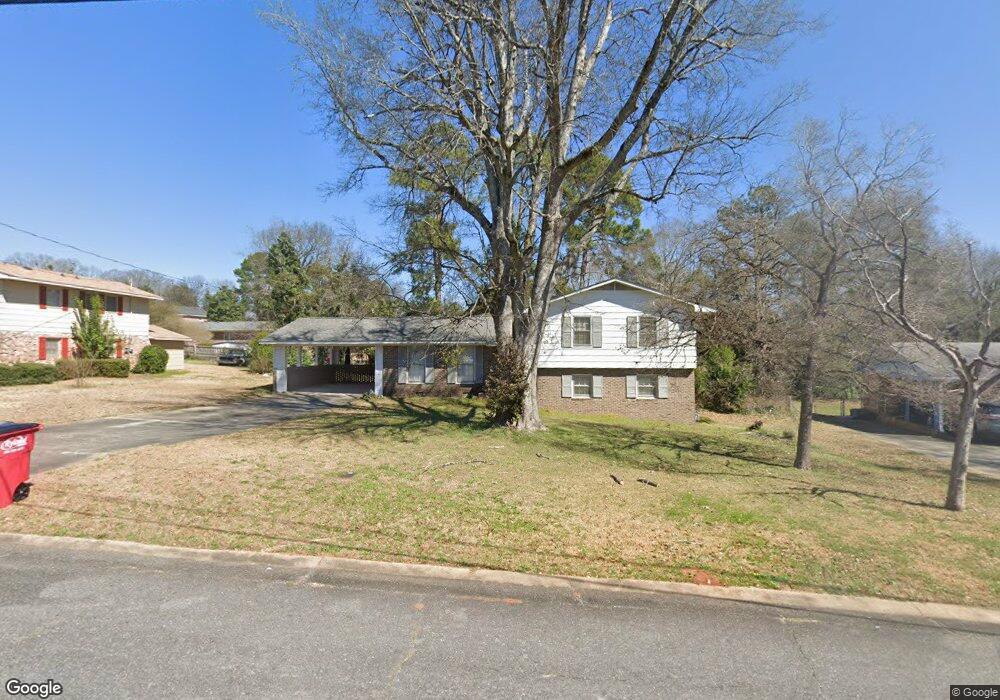
2565 Bedford Place Unit 956 Macon, GA 31211
Estimated Value: $137,000 - $168,000
3
Beds
3
Baths
2,045
Sq Ft
$76/Sq Ft
Est. Value
About This Home
This home is located at 2565 Bedford Place Unit 956, Macon, GA 31211 and is currently estimated at $155,212, approximately $75 per square foot. 2565 Bedford Place Unit 956 is a home located in Bibb County with nearby schools including Martin Luther King Jr. Elementary School, Appling Middle School, and Northeast High School.
Ownership History
Date
Name
Owned For
Owner Type
Purchase Details
Closed on
Jul 2, 2024
Sold by
Stephens Tarbaries A
Bought by
Seirabrat Enterprise Llc
Current Estimated Value
Purchase Details
Closed on
Jun 12, 2020
Sold by
Coates Richard and Coates Anthony L
Bought by
Gibson T Baron
Home Financials for this Owner
Home Financials are based on the most recent Mortgage that was taken out on this home.
Original Mortgage
$64,425
Interest Rate
3.2%
Mortgage Type
New Conventional
Purchase Details
Closed on
May 15, 2020
Sold by
Wimbush Mary Coates
Bought by
Coates Richard and Coates Anthony L
Home Financials for this Owner
Home Financials are based on the most recent Mortgage that was taken out on this home.
Original Mortgage
$64,425
Interest Rate
3.2%
Mortgage Type
New Conventional
Purchase Details
Closed on
Sep 20, 1991
Sold by
Wimbush Mary Coates
Bought by
Coates Richard Jr -
Create a Home Valuation Report for This Property
The Home Valuation Report is an in-depth analysis detailing your home's value as well as a comparison with similar homes in the area
Home Values in the Area
Average Home Value in this Area
Purchase History
| Date | Buyer | Sale Price | Title Company |
|---|---|---|---|
| Seirabrat Enterprise Llc | -- | None Listed On Document | |
| Gibson T Baron | $85,900 | None Available | |
| Coates Richard | -- | None Available | |
| Coates Richard Jr - | -- | -- |
Source: Public Records
Mortgage History
| Date | Status | Borrower | Loan Amount |
|---|---|---|---|
| Previous Owner | Gibson T Baron | $64,425 |
Source: Public Records
Tax History Compared to Growth
Tax History
| Year | Tax Paid | Tax Assessment Tax Assessment Total Assessment is a certain percentage of the fair market value that is determined by local assessors to be the total taxable value of land and additions on the property. | Land | Improvement |
|---|---|---|---|---|
| 2025 | $1,346 | $54,782 | $5,440 | $49,342 |
| 2024 | $1,235 | $48,638 | $3,400 | $45,238 |
| 2023 | $1,279 | $43,173 | $2,040 | $41,133 |
| 2022 | $1,566 | $45,242 | $3,984 | $41,258 |
| 2021 | $1,122 | $29,522 | $3,266 | $26,256 |
| 2020 | $1,124 | $28,942 | $3,266 | $25,676 |
| 2019 | $1,133 | $28,942 | $3,266 | $25,676 |
| 2018 | $1,495 | $28,942 | $3,266 | $25,676 |
| 2017 | $822 | $28,942 | $3,266 | $25,676 |
| 2016 | $759 | $28,942 | $3,266 | $25,676 |
| 2015 | $1,035 | $28,121 | $3,266 | $24,855 |
| 2014 | $1,241 | $28,121 | $3,266 | $24,855 |
Source: Public Records
Map
Nearby Homes
- 2557 Hyde Park Rd
- 2458 Tredway Dr
- 2630 Pauladale Dr
- 2761 Walnut Creek Rd
- 2371 Kensington Rd
- 2815 New Clinton Rd
- 240 Neptune Ct
- 2029 Kitchens Rd
- 1957 Kitchens Rd
- 161 Woodward Ct
- 131 Sun Valley Dr
- 699 Jasmine Dr
- 699 Jasmine Dr Unit C48
- Birch Plan at Clifton Ridge
- Lane Plan at Clifton Ridge
- Benton Plan at Clifton Ridge
- Duke Plan at Clifton Ridge
- Brooke Plan at Clifton Ridge
- Delilah Plan at Clifton Ridge
- 687 Jasmine Dr
- 2565 Bedford Place
- 2571 Bedford Place
- 2557 Bedford Place
- 2570 Hyde Park Rd
- 2564 Hyde Park Rd
- 2576 Hyde Park Rd
- 2549 Bedford Place
- 2556 Hyde Park Rd
- 2562 Bedford Place
- 2583 Bedford Place
- 2570 Bedford Place
- 2548 Bedford Place
- 2588 Hyde Park Rd
- 2582 Bedford Place
- 2548 Hyde Park Rd
- 2536 Bedford Place
- 2541 Bedford Place
- 2595 Bedford Place
- 2565 Hyde Park Rd
- 2571 Hyde Park Rd