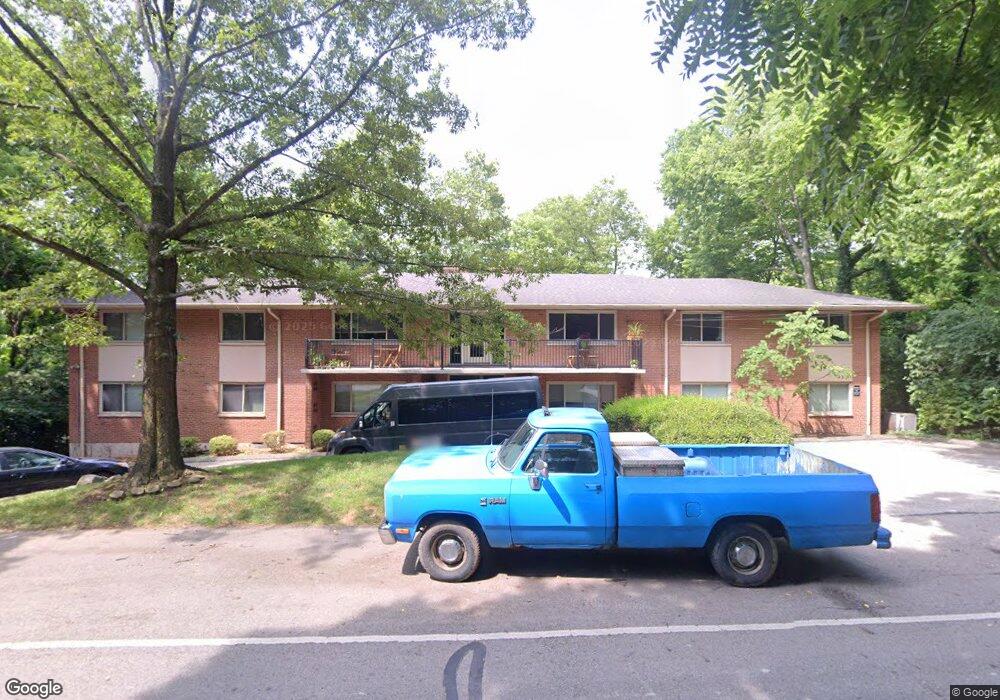
2565 Charing Rd Columbus, OH 43221
Estimated Value: $281,000 - $323,000
3
Beds
2
Baths
1,452
Sq Ft
$202/Sq Ft
Est. Value
About This Home
This home is located at 2565 Charing Rd, Columbus, OH 43221 and is currently estimated at $292,901, approximately $201 per square foot. 2565 Charing Rd is a home located in Franklin County with nearby schools including Tremont Elementary School, Jones Middle School, and Upper Arlington High School.
Ownership History
Date
Name
Owned For
Owner Type
Purchase Details
Closed on
Jun 2, 2023
Sold by
Hayden Acquisitions Llc
Bought by
Maxwell Amy S
Current Estimated Value
Purchase Details
Closed on
Oct 11, 2022
Sold by
Ptm Investments Llc
Bought by
Hayden Acquisitions Llc
Purchase Details
Closed on
Jul 10, 2014
Sold by
Ross Priscilla
Bought by
Ptm Investments Llc
Purchase Details
Closed on
Dec 31, 2013
Sold by
Ashleman Valerie S
Bought by
Ross Priscilla
Purchase Details
Closed on
May 21, 2003
Sold by
Gadzinski Mark
Bought by
Ashleman Valerie S
Home Financials for this Owner
Home Financials are based on the most recent Mortgage that was taken out on this home.
Original Mortgage
$105,200
Interest Rate
5.88%
Mortgage Type
Purchase Money Mortgage
Purchase Details
Closed on
Dec 1, 1983
Bought by
Metzger Susan J
Purchase Details
Closed on
Mar 1, 1979
Bought by
Metzger Susan J
Create a Home Valuation Report for This Property
The Home Valuation Report is an in-depth analysis detailing your home's value as well as a comparison with similar homes in the area
Home Values in the Area
Average Home Value in this Area
Purchase History
| Date | Buyer | Sale Price | Title Company |
|---|---|---|---|
| Maxwell Amy S | -- | None Listed On Document | |
| Hayden Acquisitions Llc | $255,000 | Crown Search Box | |
| Ptm Investments Llc | -- | -- | |
| Ross Priscilla | $105,000 | None Available | |
| Ashleman Valerie S | $131,500 | Lawyers Title | |
| Metzger Susan J | -- | -- | |
| Metzger Susan J | $60,900 | -- |
Source: Public Records
Mortgage History
| Date | Status | Borrower | Loan Amount |
|---|---|---|---|
| Previous Owner | Ashleman Valerie S | $105,200 |
Source: Public Records
Tax History
| Year | Tax Paid | Tax Assessment Tax Assessment Total Assessment is a certain percentage of the fair market value that is determined by local assessors to be the total taxable value of land and additions on the property. | Land | Improvement |
|---|---|---|---|---|
| 2025 | $4,697 | $81,130 | $17,500 | $63,630 |
| 2024 | $4,697 | $81,130 | $17,500 | $63,630 |
| 2023 | $4,729 | $81,130 | $17,500 | $63,630 |
| 2022 | $3,917 | $54,990 | $17,500 | $37,490 |
| 2021 | $3,479 | $54,990 | $17,500 | $37,490 |
| 2020 | $3,449 | $54,990 | $17,500 | $37,490 |
| 2019 | $3,122 | $44,000 | $14,000 | $30,000 |
| 2018 | $2,811 | $44,000 | $14,000 | $30,000 |
| 2017 | $2,797 | $44,000 | $14,000 | $30,000 |
| 2016 | $2,495 | $36,750 | $14,000 | $22,750 |
| 2015 | $2,493 | $36,750 | $14,000 | $22,750 |
| 2014 | $2,430 | $36,750 | $14,000 | $22,750 |
| 2013 | $2,006 | $57,750 | $14,000 | $43,750 |
Source: Public Records
Map
Nearby Homes
- 2593 Olde Hill Ct N Unit D2593
- 2827 Katmai Dr
- 2833 Katmai Dr
- 2808 Kobuk Dr
- 2835 Katmai Dr
- 2800 Kobuk Dr
- The Sierra Plan at Quarry Trails - Single Family Homes
- The Aspen Plan at Quarry Trails - Single Family Homes
- The Whitney Plan at Quarry Trails - Single Family Homes
- 2841 Katmai Dr
- 2806 Kobuk Dr
- 2845 Katmai Dr
- 2851 Katmai Dr
- 2812 Kobuk Dr
- 2828 Kobuk Dr
- 2853 Katmai Dr
- 2832 Kobuk Dr
- 2872 Kobuk Dr
- 2878 Kobuk Dr
- 2502 Quarry Trails Dr
- 2565 Charing Rd Unit 5
- 2565 Charing Rd Unit 2
- 2565 Charing Rd Unit 3
- 2565 Charing Rd
- 2565 Charing Rd
- 2565 Charing Rd
- 2565 Charing Rd
- 2565 Charing Rd Unit 7
- 2565 Charing Rd Unit 1
- 2565 Charing Rd Unit 4
- 2565 Charing Rd Unit 8
- 2565 Charing Woods Unit 4
- 2544 Charing Rd
- 2560 Riverside Dr
- 2560 Riverside Dr
- 2560 Riverside Dr
- 2560 Riverside Dr Unit D
- 2560 Riverside Dr Unit C
- 2537 Charing Rd
- 2557 Charing Rd Unit 2557
Your Personal Tour Guide
Ask me questions while you tour the home.