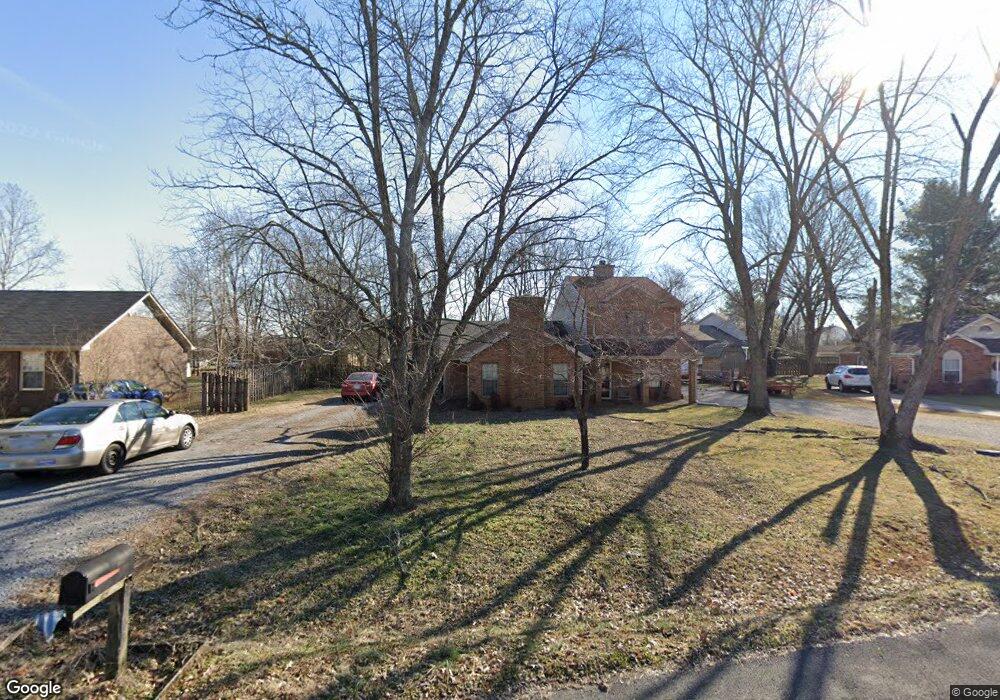
2566 Concord Ct Murfreesboro, TN 37130
Estimated Value: $231,947 - $244,000
--
Bed
2
Baths
1,110
Sq Ft
$214/Sq Ft
Est. Value
About This Home
This home is located at 2566 Concord Ct, Murfreesboro, TN 37130 and is currently estimated at $237,987, approximately $214 per square foot. 2566 Concord Ct is a home located in Rutherford County with nearby schools including John Pittard Elementary School, Oakland Middle School, and Oakland High School.
Ownership History
Date
Name
Owned For
Owner Type
Purchase Details
Closed on
Apr 29, 2010
Sold by
Bebout Jennifer Rury
Bought by
Jones Construction Co
Current Estimated Value
Purchase Details
Closed on
Jun 30, 2005
Sold by
Dale Bucklew Jason
Bought by
Jennifer Rury
Home Financials for this Owner
Home Financials are based on the most recent Mortgage that was taken out on this home.
Original Mortgage
$70,320
Interest Rate
6.29%
Purchase Details
Closed on
Jan 3, 2002
Sold by
Hiett Jackie M and Hiett Priscilla
Bought by
Dale Bucklew Jason
Home Financials for this Owner
Home Financials are based on the most recent Mortgage that was taken out on this home.
Original Mortgage
$74,602
Interest Rate
6.99%
Purchase Details
Closed on
Jul 30, 1999
Sold by
Patterson Doyle E
Bought by
Hiett Jackie M and Hiett Priscilla
Create a Home Valuation Report for This Property
The Home Valuation Report is an in-depth analysis detailing your home's value as well as a comparison with similar homes in the area
Home Values in the Area
Average Home Value in this Area
Purchase History
| Date | Buyer | Sale Price | Title Company |
|---|---|---|---|
| Jones Construction Co | $93,000 | -- | |
| Jennifer Rury | $87,900 | -- | |
| Dale Bucklew Jason | $75,200 | -- | |
| Hiett Jackie M | $65,500 | -- |
Source: Public Records
Mortgage History
| Date | Status | Borrower | Loan Amount |
|---|---|---|---|
| Previous Owner | Hiett Jackie M | $70,320 | |
| Previous Owner | Hiett Jackie M | $17,580 | |
| Previous Owner | Hiett Jackie M | $74,602 |
Source: Public Records
Tax History Compared to Growth
Tax History
| Year | Tax Paid | Tax Assessment Tax Assessment Total Assessment is a certain percentage of the fair market value that is determined by local assessors to be the total taxable value of land and additions on the property. | Land | Improvement |
|---|---|---|---|---|
| 2025 | $1,140 | $40,275 | $8,750 | $31,525 |
| 2024 | $1,140 | $40,275 | $8,750 | $31,525 |
| 2023 | $757 | $40,363 | $8,750 | $31,613 |
| 2022 | $652 | $40,363 | $8,750 | $31,613 |
| 2021 | $666 | $29,988 | $6,000 | $23,988 |
| 2020 | $666 | $29,988 | $6,000 | $23,988 |
| 2019 | $666 | $29,988 | $6,000 | $23,988 |
| 2018 | $915 | $29,988 | $0 | $0 |
| 2017 | $887 | $22,825 | $0 | $0 |
| 2016 | $887 | $22,825 | $0 | $0 |
| 2015 | $887 | $22,825 | $0 | $0 |
| 2014 | $568 | $22,825 | $0 | $0 |
| 2013 | -- | $25,750 | $0 | $0 |
Source: Public Records
Map
Nearby Homes
- 2164 White Poplar Ct
- 2111 Lovelace Ln
- 2223 Brick Way
- 2110 Stillwell Ct
- 0 Pitts Ln
- 2427 Donald Bradley Ct
- 1512 Mirabella Way
- 1430 Avellino Cir
- 2403 English Hill Dr
- 1640 Drayton Dr
- 2510 Mission Ridge Dr
- 1409 E Northfield Blvd
- 2303 Lionheart Dr
- 2326 Laurelstone Dr
- 2328 Laurelstone Dr
- 2336 Laurelstone Dr
- 2428 Sandstone Cir
- 1913 Baskinbrook Ct
- 2607 Mission Ridge Dr
- 2331 Lionheart Dr
- 2564 Concord Ct
- 2574 Concord Ct
- 2576 Concord Ct
- 2556 Concord Ct
- 2561 Saratoga Ct Unit 2563
- 2584 Concord Ct
- 2571 Saratoga Ct
- 2553 Saratoga Ct
- 2573 Saratoga Ct
- 2554 Concord Ct
- 2565 Concord Ct
- 2586 Concord Ct
- 2581 Saratoga Ct
- 2563 Concord Ct
- 2573 Concord Ct
- 2546 Concord Ct
- 2575 Concord Ct
- 2551 Saratoga Ct
- 2583 Saratoga Ct
- 2555 Concord Ct