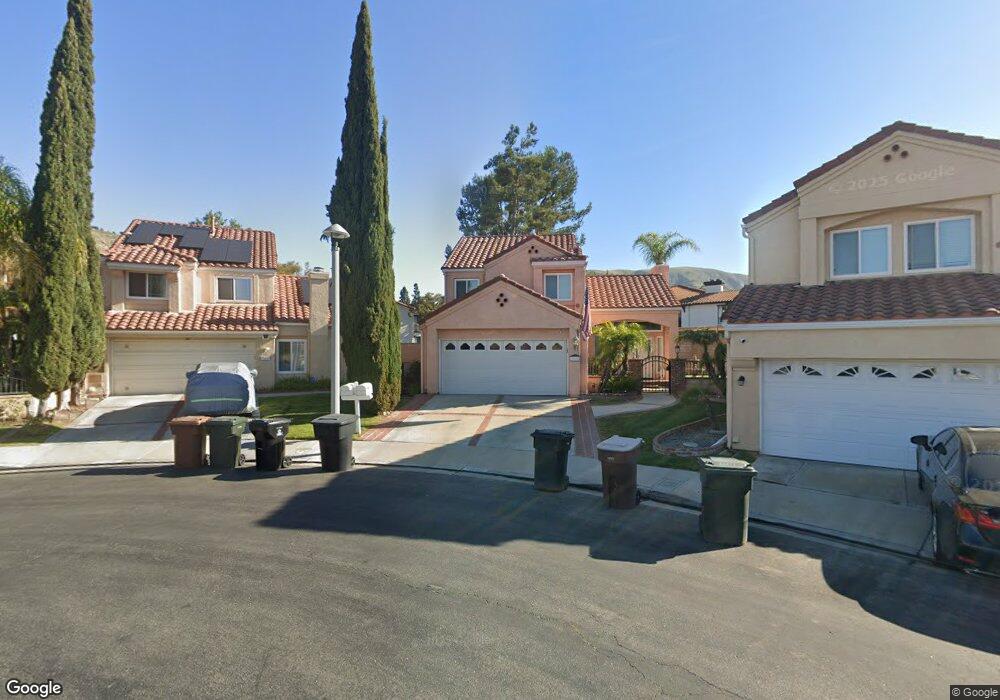
25665 Triesta Way Yorba Linda, CA 92887
Estimated Value: $960,443 - $1,153,000
3
Beds
3
Baths
1,523
Sq Ft
$702/Sq Ft
Est. Value
About This Home
This home is located at 25665 Triesta Way, Yorba Linda, CA 92887 and is currently estimated at $1,069,111, approximately $701 per square foot. 25665 Triesta Way is a home located in Orange County with nearby schools including Bryant Ranch Elementary School, Travis Ranch Middle School, and Yorba Linda High School.
Ownership History
Date
Name
Owned For
Owner Type
Purchase Details
Closed on
Mar 6, 1998
Sold by
Brian Gibson Paul
Bought by
Clarke Jonathan K and Clarke Romy E
Current Estimated Value
Home Financials for this Owner
Home Financials are based on the most recent Mortgage that was taken out on this home.
Original Mortgage
$210,900
Outstanding Balance
$38,514
Interest Rate
7%
Estimated Equity
$1,030,597
Purchase Details
Closed on
May 24, 1995
Sold by
Federal Home Loan Mortgage Corporation
Bought by
Gibson Paul Brian
Home Financials for this Owner
Home Financials are based on the most recent Mortgage that was taken out on this home.
Original Mortgage
$177,650
Interest Rate
8.32%
Purchase Details
Closed on
Feb 6, 1995
Sold by
Ge Capital Mtg Services Inc
Bought by
Federal Home Loan Mortgage Corporation
Purchase Details
Closed on
Feb 2, 1995
Sold by
Ge Capital Mtg Services Inc
Bought by
Ge Capital Mtg Services Inc and Travelers Mtg Services Inc
Create a Home Valuation Report for This Property
The Home Valuation Report is an in-depth analysis detailing your home's value as well as a comparison with similar homes in the area
Home Values in the Area
Average Home Value in this Area
Purchase History
| Date | Buyer | Sale Price | Title Company |
|---|---|---|---|
| Clarke Jonathan K | $222,000 | Chicago Title Co | |
| Gibson Paul Brian | $187,000 | Orange Coast Title | |
| Federal Home Loan Mortgage Corporation | -- | First Southwestern Title Co | |
| Ge Capital Mtg Services Inc | $2,046,916 | First Southwestern Title Co |
Source: Public Records
Mortgage History
| Date | Status | Borrower | Loan Amount |
|---|---|---|---|
| Open | Clarke Jonathan K | $210,900 | |
| Previous Owner | Gibson Paul Brian | $177,650 |
Source: Public Records
Tax History Compared to Growth
Tax History
| Year | Tax Paid | Tax Assessment Tax Assessment Total Assessment is a certain percentage of the fair market value that is determined by local assessors to be the total taxable value of land and additions on the property. | Land | Improvement |
|---|---|---|---|---|
| 2025 | $4,263 | $354,468 | $168,398 | $186,070 |
| 2024 | $4,263 | $347,518 | $165,096 | $182,422 |
| 2023 | $4,130 | $340,704 | $161,858 | $178,846 |
| 2022 | $4,055 | $334,024 | $158,684 | $175,340 |
| 2021 | $3,974 | $327,475 | $155,573 | $171,902 |
| 2020 | $3,905 | $324,118 | $153,978 | $170,140 |
| 2019 | $3,807 | $317,763 | $150,959 | $166,804 |
| 2018 | $3,811 | $311,533 | $147,999 | $163,534 |
| 2017 | $3,993 | $305,425 | $145,097 | $160,328 |
| 2016 | $3,637 | $299,437 | $142,252 | $157,185 |
| 2015 | $3,764 | $294,940 | $140,116 | $154,824 |
| 2014 | $3,695 | $289,163 | $137,371 | $151,792 |
Source: Public Records
Map
Nearby Homes
- 25633 Corsica Way
- 5917 San Remo Way
- 0 Meadow Land Dr
- 25540 Aragon Way
- 5570 Meadow Lake Ln
- 25511 Palermo Way
- 27870 Tamara Dr
- 28685 Morning Dew Way
- 23964 Old Pomegranate Rd
- 5527 Patricia Way
- 23985 Nicole Way Unit 31
- 5425 Castle Bend Way
- 27170 Big Horn Mountain Way
- 24670 Paseo de Toronto
- 27025 Glaramara Ln
- 27055 Big Horn Mountain Way
- 5420 Los Monteros
- 23556 Cambridge Rd Unit 327
- 23502 Cambridge Rd Unit 306
- 23482 Cambridge Rd Unit 294
- 25655 Triesta Way
- 25675 Triesta Way
- 25645 Triesta Way
- 25685 Triesta Way
- 25635 Triesta Way
- 25660 Triesta Way
- 25695 Triesta Way
- 25650 Triesta Way
- 25625 Triesta Way
- 25705 Triesta Way
- 25639 Corsica Way
- 25640 Triesta Way
- 25615 Triesta Way
- 25637 Corsica Way
- 25630 Triesta Way
- 25601 Triesta Way
- 25635 Corsica Way
- 25620 Triesta Way
- 25644 Corsica Way
- 25595 Triesta Way