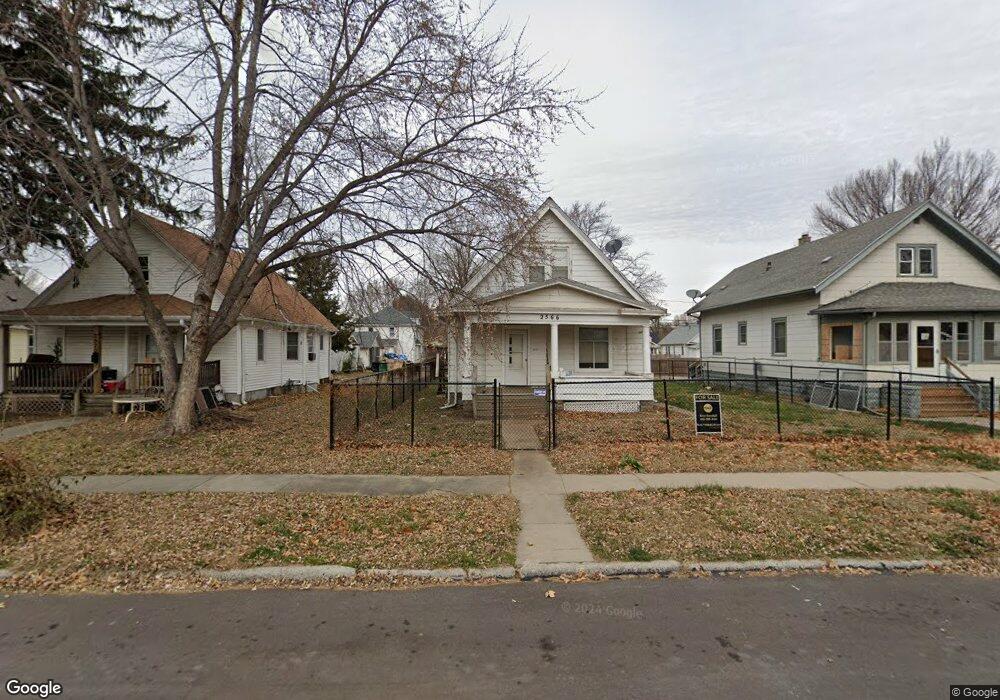
2567 Fort St Omaha, NE 68111
Miller Park-Minne-Lusa NeighborhoodEstimated Value: $131,604 - $220,000
4
Beds
1
Bath
1,132
Sq Ft
$144/Sq Ft
Est. Value
About This Home
This home is located at 2567 Fort St, Omaha, NE 68111 and is currently estimated at $163,401, approximately $144 per square foot. 2567 Fort St is a home located in Douglas County with nearby schools including Miller Park Elementary School, McMillan Middle School, and North High School.
Ownership History
Date
Name
Owned For
Owner Type
Purchase Details
Closed on
Jul 20, 2018
Sold by
Ramos Fausto and Valadez Natalia
Bought by
Avalos Ramirez Sergio Arturo
Current Estimated Value
Purchase Details
Closed on
Sep 14, 2016
Sold by
Henerson Scott and Henerson Monica
Bought by
Ramos Fausto and Valdez Natalia
Purchase Details
Closed on
Aug 31, 2016
Sold by
Sandrerson Carol J and Sandrerson Richard L
Bought by
Henderson Scott and Henderson Monica
Purchase Details
Closed on
Aug 3, 2016
Sold by
Sandeson Carol J
Bought by
Sanderson Carol J
Purchase Details
Closed on
Nov 4, 2015
Sold by
Kohl Todd A
Bought by
Sanderson Carol J and Carol J Sanderson Grantor Tru
Purchase Details
Closed on
Jan 13, 2015
Sold by
Sanderson Carol J
Bought by
Kohl Todd A
Purchase Details
Closed on
Jun 13, 2011
Sold by
Pinnacle Bank
Bought by
Sanderson Carol J
Purchase Details
Closed on
Feb 10, 2011
Sold by
Stevens Robert S and Stevens Lori K
Bought by
Pinnacle Bank
Create a Home Valuation Report for This Property
The Home Valuation Report is an in-depth analysis detailing your home's value as well as a comparison with similar homes in the area
Home Values in the Area
Average Home Value in this Area
Purchase History
| Date | Buyer | Sale Price | Title Company |
|---|---|---|---|
| Avalos Ramirez Sergio Arturo | $20,000 | None Available | |
| Ramos Fausto | $15,000 | None Available | |
| Henderson Scott | $8,000 | None Available | |
| Sanderson Carol J | -- | None Available | |
| Sanderson Carol J | -- | None Available | |
| Kohl Todd A | -- | None Available | |
| Sanderson Carol J | $14,000 | Ambassador Title Services | |
| Pinnacle Bank | $18,000 | None Available |
Source: Public Records
Tax History Compared to Growth
Tax History
| Year | Tax Paid | Tax Assessment Tax Assessment Total Assessment is a certain percentage of the fair market value that is determined by local assessors to be the total taxable value of land and additions on the property. | Land | Improvement |
|---|---|---|---|---|
| 2024 | $1,614 | $104,400 | $5,300 | $99,100 |
| 2023 | $1,614 | $76,500 | $5,300 | $71,200 |
| 2022 | $1,381 | $64,700 | $5,300 | $59,400 |
| 2021 | $1,128 | $53,300 | $5,300 | $48,000 |
| 2020 | $495 | $23,100 | $5,300 | $17,800 |
| 2019 | $432 | $20,100 | $800 | $19,300 |
| 2018 | $432 | $20,100 | $800 | $19,300 |
| 2017 | $826 | $20,100 | $800 | $19,300 |
| 2016 | $826 | $38,500 | $700 | $37,800 |
| 2015 | $830 | $39,200 | $2,500 | $36,700 |
| 2014 | $830 | $39,200 | $2,500 | $36,700 |
Source: Public Records
Map
Nearby Homes
- 2524 Fort St
- 5315 N 26th St
- 2619 Fort St
- 2434 Camden Ave
- 2439 Camden Ave
- 5331 N 27th Ave
- 2732 Camden Ave
- 5347 N 27th Ave
- 2738 Browne St
- 4918 N 27th St
- 2424 Ellison Ave
- 5611 N 27th St
- 2436 Larimore Ave
- 2306 Ogden St
- 2432 Larimore Ave
- 5340 N 28th Ave
- 5014 N 23rd St
- 2504 Hartman Ave
- 2711 Himebaugh Ave
- 4764 N 24th St