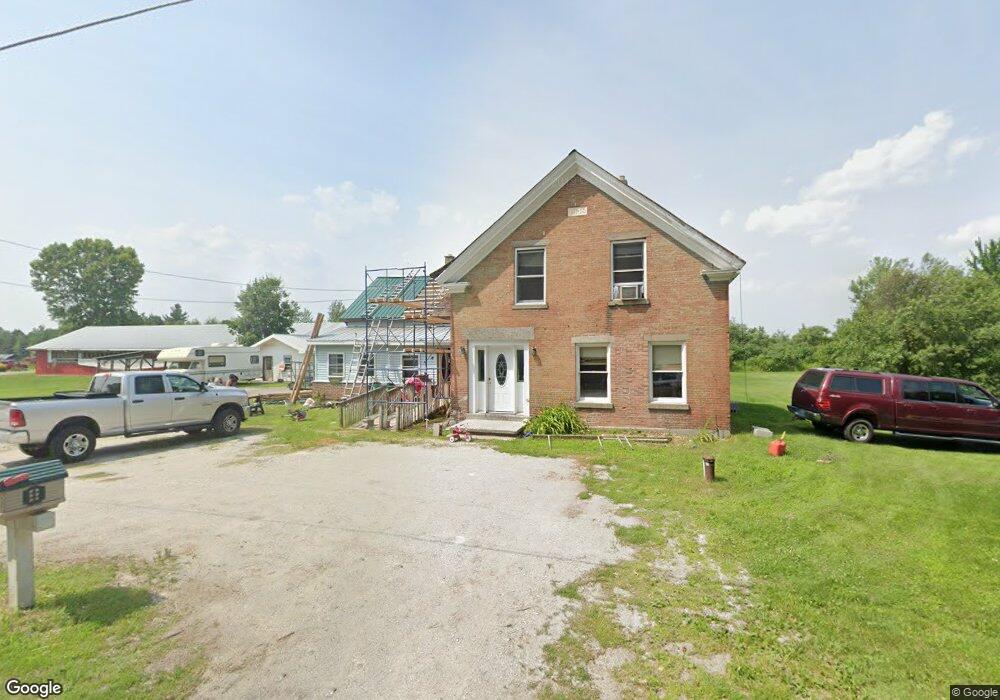
2567 MacHia Rd Sheldon, VT 05483
Estimated Value: $337,093 - $475,000
5
Beds
2
Baths
2,862
Sq Ft
$147/Sq Ft
Est. Value
About This Home
This home is located at 2567 MacHia Rd, Sheldon, VT 05483 and is currently estimated at $421,031, approximately $147 per square foot. 2567 MacHia Rd is a home located in Franklin County with nearby schools including Highgate Elementary School and Missisquoi Valley Union Middle/High School.
Ownership History
Date
Name
Owned For
Owner Type
Purchase Details
Closed on
Sep 26, 2023
Sold by
Mcdade Debora
Bought by
Turner Samantha and Turner Jered
Current Estimated Value
Purchase Details
Closed on
Sep 6, 2019
Sold by
Machia Thorton
Bought by
Machia Dustin
Purchase Details
Closed on
Jan 22, 2016
Sold by
Machia Thorton J
Bought by
Mcdade Debora J
Purchase Details
Closed on
Jan 24, 2013
Sold by
Machia Thorton J
Bought by
Machia Sherry L
Create a Home Valuation Report for This Property
The Home Valuation Report is an in-depth analysis detailing your home's value as well as a comparison with similar homes in the area
Home Values in the Area
Average Home Value in this Area
Purchase History
We collect this data history from publicly available records. To have your information removed, we recommend requesting removal directly through your county’s website.
| Date | Buyer | Sale Price | Title Company |
|---|---|---|---|
| Turner Samantha | $2,000 | -- | |
| Turner Samantha | $2,000 | -- | |
| Machia Thornton | $40,825 | -- | |
| Machia Dustin | $9,000 | -- | |
| Machia Dustin | $9,000 | -- | |
| Machia Dustin | $9,000 | -- | |
| Mcdade Debora J | -- | -- | |
| Mcdade Debora J | -- | -- | |
| Machia Sherry L | -- | -- | |
| Machia Regina A | -- | -- | |
| Machia Sherry L | -- | -- |
Source: Public Records
Tax History
| Year | Tax Paid | Tax Assessment Tax Assessment Total Assessment is a certain percentage of the fair market value that is determined by local assessors to be the total taxable value of land and additions on the property. | Land | Improvement |
|---|---|---|---|---|
| 2024 | $5,802 | $273,300 | $81,100 | $192,200 |
| 2023 | $5,802 | $288,100 | $95,900 | $192,200 |
| 2022 | $5,269 | $288,100 | $95,900 | $192,200 |
| 2021 | $5,245 | $288,100 | $95,900 | $192,200 |
| 2020 | $5,137 | $288,100 | $95,900 | $192,200 |
| 2019 | $5,754 | $307,500 | $115,300 | $192,200 |
| 2018 | $5,501 | $307,500 | $115,300 | $192,200 |
| 2017 | $5,341 | $307,500 | $115,300 | $192,200 |
| 2016 | $5,076 | $307,500 | $115,300 | $192,200 |
| 2015 | -- | $3,075 | $0 | $0 |
| 2014 | -- | $3,075 | $0 | $0 |
| 2013 | -- | $4,054 | $0 | $0 |
Source: Public Records
Map
Nearby Homes
Your Personal Tour Guide
Ask me questions while you tour the home.