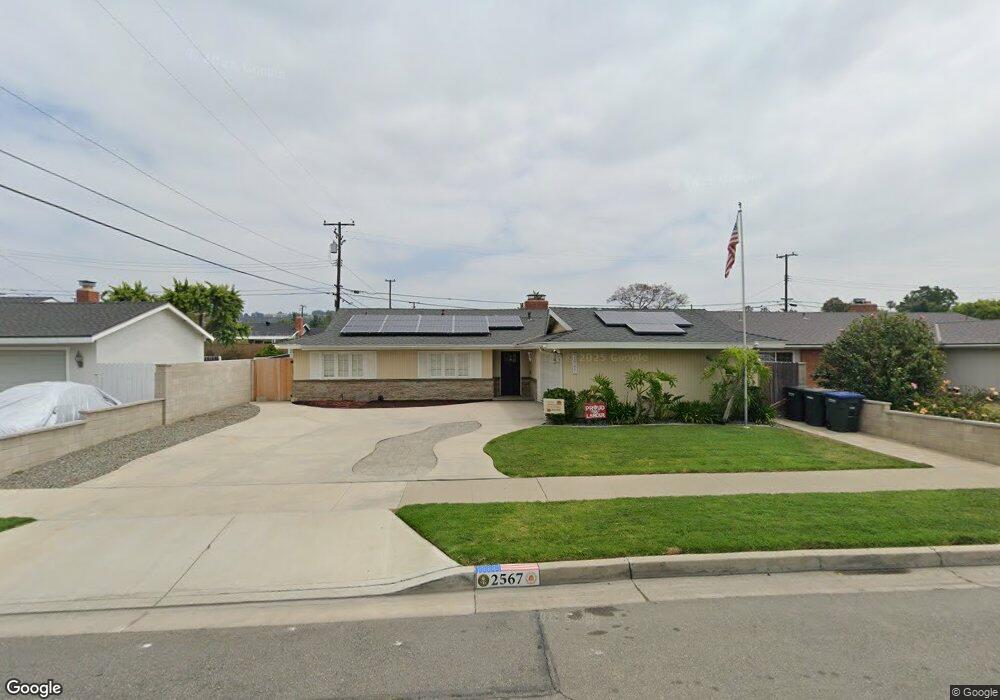
2567 N Torres St Orange, CA 92865
Estimated Value: $1,193,000 - $1,394,000
3
Beds
2
Baths
2,263
Sq Ft
$556/Sq Ft
Est. Value
About This Home
This home is located at 2567 N Torres St, Orange, CA 92865 and is currently estimated at $1,257,980, approximately $555 per square foot. 2567 N Torres St is a home located in Orange County with nearby schools including Olive Elementary School, Cerro Villa Middle School, and Villa Park High School.
Ownership History
Date
Name
Owned For
Owner Type
Purchase Details
Closed on
Oct 3, 2015
Sold by
Jackson Matthew S and Jackson Mathew S
Bought by
Jackson Matthew S and Jackson Amy
Current Estimated Value
Home Financials for this Owner
Home Financials are based on the most recent Mortgage that was taken out on this home.
Original Mortgage
$552,807
Outstanding Balance
$432,566
Interest Rate
3.72%
Mortgage Type
VA
Estimated Equity
$825,414
Purchase Details
Closed on
Oct 26, 2011
Sold by
Jackson Amy Elizabeth
Bought by
Jackson Matthew S
Home Financials for this Owner
Home Financials are based on the most recent Mortgage that was taken out on this home.
Original Mortgage
$464,074
Interest Rate
4.01%
Mortgage Type
VA
Purchase Details
Closed on
Aug 5, 2010
Sold by
Jackson Mathew S
Bought by
Jackson Mathew S and Jackson Amy Elizabeth
Purchase Details
Closed on
Jul 17, 2009
Sold by
Jackson Amy
Bought by
Jackson Matthew S
Home Financials for this Owner
Home Financials are based on the most recent Mortgage that was taken out on this home.
Original Mortgage
$459,675
Interest Rate
5.59%
Mortgage Type
VA
Purchase Details
Closed on
Jun 25, 2009
Sold by
Youmans Jacob and Youmans Christy
Bought by
Jackson Matthew S
Home Financials for this Owner
Home Financials are based on the most recent Mortgage that was taken out on this home.
Original Mortgage
$459,675
Interest Rate
5.59%
Mortgage Type
VA
Purchase Details
Closed on
Sep 16, 2004
Sold by
Wilcox Lisa M
Bought by
Youmans Jacob and Youmans Christy
Home Financials for this Owner
Home Financials are based on the most recent Mortgage that was taken out on this home.
Original Mortgage
$350,000
Interest Rate
5.37%
Mortgage Type
New Conventional
Purchase Details
Closed on
Jun 20, 2002
Sold by
Wilcox Eric D
Bought by
Wilcox Lisa M
Home Financials for this Owner
Home Financials are based on the most recent Mortgage that was taken out on this home.
Original Mortgage
$251,240
Interest Rate
6.74%
Purchase Details
Closed on
Oct 23, 1997
Sold by
Dewain Wilcox and Dewain Melva
Bought by
Wilcox Eric D and Wilcox Lisa M
Home Financials for this Owner
Home Financials are based on the most recent Mortgage that was taken out on this home.
Original Mortgage
$176,000
Interest Rate
7.36%
Purchase Details
Closed on
Apr 15, 1994
Sold by
Vandeventer Scott T and Vandeventer Martha I
Bought by
Wilcox Dewain H and Wilcox Melva A
Home Financials for this Owner
Home Financials are based on the most recent Mortgage that was taken out on this home.
Original Mortgage
$176,000
Interest Rate
8.52%
Create a Home Valuation Report for This Property
The Home Valuation Report is an in-depth analysis detailing your home's value as well as a comparison with similar homes in the area
Home Values in the Area
Average Home Value in this Area
Purchase History
| Date | Buyer | Sale Price | Title Company |
|---|---|---|---|
| Jackson Matthew S | -- | First American Title Ins Co | |
| Jackson Matthew S | -- | Commerce Title Company | |
| Jackson Mathew S | -- | None Available | |
| Jackson Matthew S | -- | Lawyers Title | |
| Jackson Matthew S | $450,000 | Lawyers | |
| Youmans Jacob | -- | North American Title Co | |
| Wilcox Lisa M | -- | Commonwealth Land Title Co | |
| Wilcox Eric D | -- | Southland Title Corporation | |
| Wilcox Dewain H | $220,000 | Orange Coast Title Company |
Source: Public Records
Mortgage History
| Date | Status | Borrower | Loan Amount |
|---|---|---|---|
| Open | Jackson Matthew S | $552,807 | |
| Closed | Jackson Matthew S | $464,074 | |
| Closed | Jackson Matthew S | $459,675 | |
| Previous Owner | Youmans Jacob | $350,000 | |
| Previous Owner | Wilcox Lisa M | $251,240 | |
| Previous Owner | Wilcox Eric D | $176,000 | |
| Previous Owner | Wilcox Dewain H | $176,000 |
Source: Public Records
Tax History Compared to Growth
Tax History
| Year | Tax Paid | Tax Assessment Tax Assessment Total Assessment is a certain percentage of the fair market value that is determined by local assessors to be the total taxable value of land and additions on the property. | Land | Improvement |
|---|---|---|---|---|
| 2025 | $6,859 | $623,896 | $425,333 | $198,563 |
| 2024 | $6,859 | $611,663 | $416,993 | $194,670 |
| 2023 | $6,708 | $599,670 | $408,817 | $190,853 |
| 2022 | $6,578 | $587,912 | $400,801 | $187,111 |
| 2021 | $6,395 | $576,385 | $392,942 | $183,443 |
| 2020 | $6,336 | $570,475 | $388,912 | $181,563 |
| 2019 | $6,257 | $559,290 | $381,287 | $178,003 |
| 2018 | $5,967 | $529,977 | $373,811 | $156,166 |
| 2017 | $5,523 | $500,495 | $366,481 | $134,014 |
| 2016 | $5,345 | $490,682 | $359,295 | $131,387 |
| 2015 | $5,266 | $483,312 | $353,898 | $129,414 |
| 2014 | $5,152 | $473,845 | $346,966 | $126,879 |
Source: Public Records
Map
Nearby Homes
- 1201 E Saint James Ave
- 2518 N Bourbon St
- 2504 N Bourbon St
- 2660 N Bourbon St
- 2525 N Bourbon St Unit E2
- 2525 N Bourbon St Unit N3
- 2348 N Glennwood St
- 1231 E Boom Ave
- 8641 N Orange Olive Rd
- 2821 N Gaff St
- 2542 N Ashwood St
- 3176 N Tustin St
- 2295 N Tustin St Unit 84
- 3002 N Pinewood St
- 2545 N Robinhood Place
- 2701 N Glenside St
- 2117 N Orange Olive Rd
- 2880 N Glassell St
- 2445 N Santiago Blvd
- 2890 N Glassell St
- 2557 N Torres St
- 2579 N Torres St
- 2564 N Franki St
- 2580 N Franki St
- 2547 N Torres St
- 2544 N Franki St
- 2593 N Torres St
- 2566 N Torres St
- 2580 N Torres St
- 2594 N Franki St
- 2556 N Torres St
- 2535 N Torres St
- 2594 N Torres St
- 2544 N Torres St
- 1100 E Darby Ave
- 2601 N Torres St
- 2567 N Franki St
- 2600 N Franki St
- 2525 N Torres St
- 2579 N Franki St