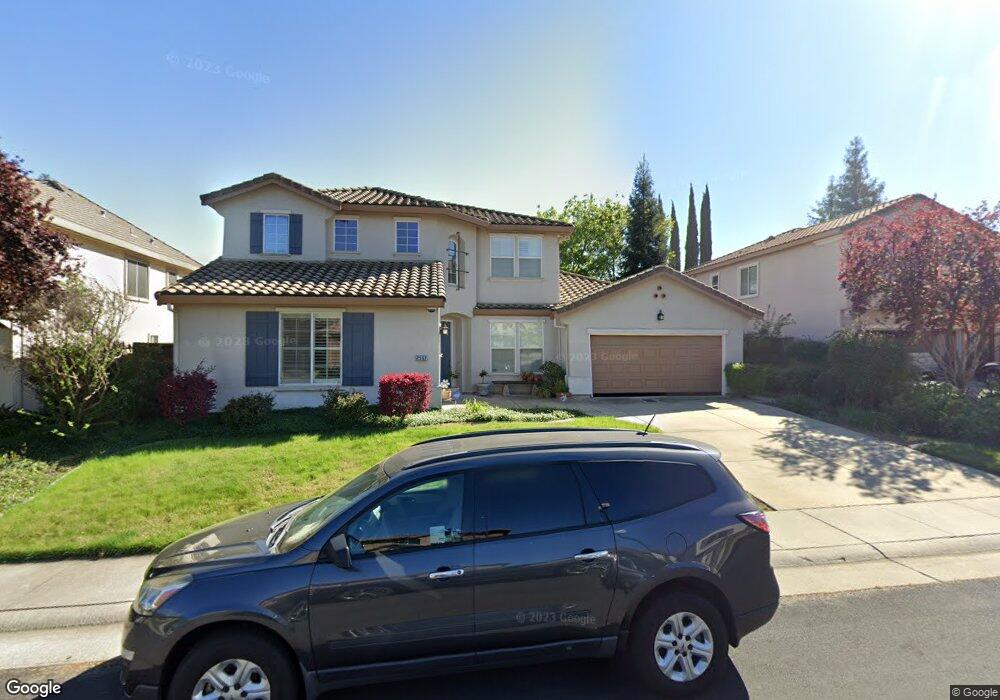
2567 Parkcrest Way Roseville, CA 95747
Blue Oaks NeighborhoodEstimated Value: $700,000 - $873,000
4
Beds
4
Baths
3,122
Sq Ft
$255/Sq Ft
Est. Value
About This Home
This home is located at 2567 Parkcrest Way, Roseville, CA 95747 and is currently estimated at $794,801, approximately $254 per square foot. 2567 Parkcrest Way is a home located in Placer County with nearby schools including Diamond Creek Elementary School, Robert C. Cooley Middle School, and Roseville High School.
Ownership History
Date
Name
Owned For
Owner Type
Purchase Details
Closed on
Jan 22, 2013
Sold by
Sisson George H and Sisson Margie L
Bought by
Sisson George H and Sisson Margie L
Current Estimated Value
Home Financials for this Owner
Home Financials are based on the most recent Mortgage that was taken out on this home.
Original Mortgage
$322,000
Outstanding Balance
$143,063
Interest Rate
3.28%
Mortgage Type
New Conventional
Estimated Equity
$651,738
Purchase Details
Closed on
Sep 19, 2007
Sold by
Sisson George H and Sisson Margie L
Bought by
Sisson George H
Purchase Details
Closed on
Apr 19, 2001
Sold by
Wl Homes Llc
Bought by
Sisson George H
Home Financials for this Owner
Home Financials are based on the most recent Mortgage that was taken out on this home.
Original Mortgage
$275,000
Interest Rate
6.98%
Create a Home Valuation Report for This Property
The Home Valuation Report is an in-depth analysis detailing your home's value as well as a comparison with similar homes in the area
Home Values in the Area
Average Home Value in this Area
Purchase History
| Date | Buyer | Sale Price | Title Company |
|---|---|---|---|
| Sisson George H | -- | Fidelity National Title Comp | |
| Sisson George H | -- | Fidelity National Title Comp | |
| Sisson George H | -- | None Available | |
| Sisson George H | $351,000 | First American Title Ins Co |
Source: Public Records
Mortgage History
| Date | Status | Borrower | Loan Amount |
|---|---|---|---|
| Open | Sisson George H | $322,000 | |
| Closed | Sisson George H | $275,000 | |
| Closed | Sisson George H | $40,620 |
Source: Public Records
Tax History Compared to Growth
Tax History
| Year | Tax Paid | Tax Assessment Tax Assessment Total Assessment is a certain percentage of the fair market value that is determined by local assessors to be the total taxable value of land and additions on the property. | Land | Improvement |
|---|---|---|---|---|
| 2025 | $3,992 | $528,408 | $158,206 | $370,202 |
| 2023 | $3,992 | $507,891 | $152,063 | $355,828 |
| 2022 | $4,576 | $497,933 | $149,082 | $348,851 |
| 2021 | $4,698 | $488,170 | $146,159 | $342,011 |
| 2020 | $4,727 | $483,166 | $144,661 | $338,505 |
| 2019 | $4,649 | $473,693 | $141,825 | $331,868 |
| 2018 | $4,573 | $464,406 | $139,045 | $325,361 |
| 2017 | $4,508 | $455,301 | $136,319 | $318,982 |
| 2016 | $4,530 | $446,375 | $133,647 | $312,728 |
| 2015 | $4,541 | $439,671 | $131,640 | $308,031 |
| 2014 | $4,525 | $431,060 | $129,062 | $301,998 |
Source: Public Records
Map
Nearby Homes
- 2548 Tradewinds Dr
- 1408 Grovewood Ln
- 1500 Woodhaven Cir
- 1725 Woodhaven Cir
- 3963 Slurry St
- 3966 Slurry St
- 3960 Slurry St
- 3953 Prairie Blues St
- 3947 Prairie Blues St
- 3945 Slurry St
- 508 Dijon Place
- 3941 Prairie Blues St
- 2753 Compile Way
- 1377 Volonne Dr
- Plan 2390 at Cambridge at Placer One
- Plan 2124 at Cambridge at Placer One
- Plan 1853 at Cambridge at Placer One
- Plan 1552 at Cambridge at Placer One
- 1393 Volonne Dr
- 1224 Impressionist Loop
- 2575 Parkcrest Way
- 2559 Parkcrest Way
- 116 Starwood Ct
- 2527 Parkcrest Way
- 2583 Parkcrest Way
- 2574 Parkcrest Way
- 108 Starwood Ct
- 2519 Parkcrest Way
- 2558 Parkcrest Way
- 2582 Parkcrest Way
- 2591 Parkcrest Way
- 2534 Parkcrest Way
- 2542 Parkcrest Way
- 2526 Parkcrest Way
- 2590 Parkcrest Way
- 2550 Parkcrest Way
- 2516 Tradewinds Dr
- 117 Starwood Ct
- 2508 Tradewinds Dr
- 2524 Tradewinds Dr