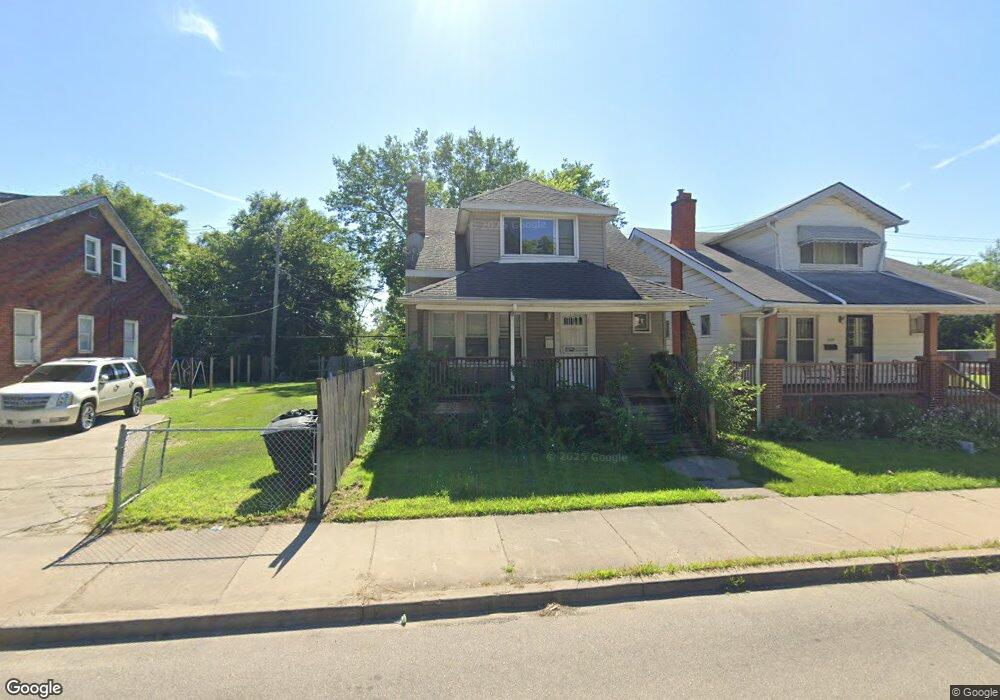
2569 Alter Rd Detroit, MI 48215
Riverbend NeighborhoodEstimated Value: $70,000 - $113,000
--
Bed
2
Baths
1,324
Sq Ft
$68/Sq Ft
Est. Value
About This Home
This home is located at 2569 Alter Rd, Detroit, MI 48215 and is currently estimated at $90,063, approximately $68 per square foot. 2569 Alter Rd is a home located in Wayne County with nearby schools including Carstens Academy of Aquatic Science, Edward 'Duke' Ellington Conservatory of Music and Art, and Charles L. Spain Elementary-Middle School.
Ownership History
Date
Name
Owned For
Owner Type
Purchase Details
Closed on
Jan 21, 2022
Sold by
M & S Management Group Llc
Bought by
Moonlight Vision Investments Llc
Current Estimated Value
Purchase Details
Closed on
Feb 28, 2011
Sold by
Safadi Remon and Musharbash Amer
Bought by
M & S Management Group Llc
Purchase Details
Closed on
Jan 24, 2006
Sold by
Bauer Kristen A
Bought by
Musharbash Amer
Purchase Details
Closed on
Jan 26, 2004
Sold by
Bauer Kristen A
Bought by
Musharbash Amer
Home Financials for this Owner
Home Financials are based on the most recent Mortgage that was taken out on this home.
Original Mortgage
$12,500
Interest Rate
7%
Mortgage Type
Seller Take Back
Purchase Details
Closed on
May 28, 2003
Sold by
Detroit Leasing Co
Bought by
Bauer Kristen A
Purchase Details
Closed on
May 13, 2003
Sold by
Kelly Michael
Bought by
Bauer Kristen A
Create a Home Valuation Report for This Property
The Home Valuation Report is an in-depth analysis detailing your home's value as well as a comparison with similar homes in the area
Home Values in the Area
Average Home Value in this Area
Purchase History
| Date | Buyer | Sale Price | Title Company |
|---|---|---|---|
| Moonlight Vision Investments Llc | $72,000 | None Listed On Document | |
| M & S Management Group Llc | -- | None Available | |
| Musharbash Amer | $20,000 | None Available | |
| Musharbash Amer | $20,000 | Regency Title | |
| Bauer Kristen A | -- | Chirco Title Company | |
| Bauer Kristen A | -- | Chirco Title Company |
Source: Public Records
Mortgage History
| Date | Status | Borrower | Loan Amount |
|---|---|---|---|
| Previous Owner | Musharbash Amer | $12,500 |
Source: Public Records
Tax History Compared to Growth
Tax History
| Year | Tax Paid | Tax Assessment Tax Assessment Total Assessment is a certain percentage of the fair market value that is determined by local assessors to be the total taxable value of land and additions on the property. | Land | Improvement |
|---|---|---|---|---|
| 2025 | $1,302 | $19,200 | $0 | $0 |
| 2024 | $1,302 | $16,800 | $0 | $0 |
| 2023 | $1,264 | $13,300 | $0 | $0 |
| 2022 | $397 | $12,500 | $0 | $0 |
| 2021 | $392 | $9,400 | $0 | $0 |
| 2020 | $392 | $12,200 | $0 | $0 |
| 2019 | $389 | $10,800 | $0 | $0 |
| 2018 | $367 | $9,200 | $0 | $0 |
| 2017 | $31 | $9,400 | $0 | $0 |
| 2016 | $382 | $1,700 | $0 | $0 |
| 2015 | $170 | $1,700 | $0 | $0 |
| 2013 | $187 | $1,871 | $0 | $0 |
| 2010 | -- | $2,742 | $349 | $2,393 |
Source: Public Records
Map
Nearby Homes
- 1324 Wayburn St
- 1316 Maryland St
- 1318 Maryland St
- 2140 Alter Rd
- 2966 Ashland St
- 1447 Wayburn St
- 2568 Alter Rd
- 1449 Wayburn St
- 1465 Maryland St
- 1306 Beaconsfield Ave Unit 1308
- 1417 Beaconsfield Ave
- 1254 Beaconsfield Ave
- 1451 Beaconsfield Ave
- 395 Chalmers St
- 2950 Lakewood St
- 14345 Kercheval St
- 1308 Ashland St
- 3064 Marlborough St
- 2651 Lakewood St
- 3080 Marlborough St
- 2563 Alter Rd
- 2575 Alter Rd
- 2557 Alter Rd
- 2568 Ashland St
- 2576 Ashland St
- 2593 Alter Rd
- 2556 Ashland St
- 2586 Ashland St
- 2564 Ashland St
- 2592 Ashland St
- 2580 Alter Rd
- 2605 Alter Rd
- 2598 Ashland St
- 2606 Ashland St
- 2527 Alter Rd
- 2610 Ashland St
- 2610 Alter Rd
- 2567 Ashland St
- 2515 Alter Rd
- 2575 Ashland St