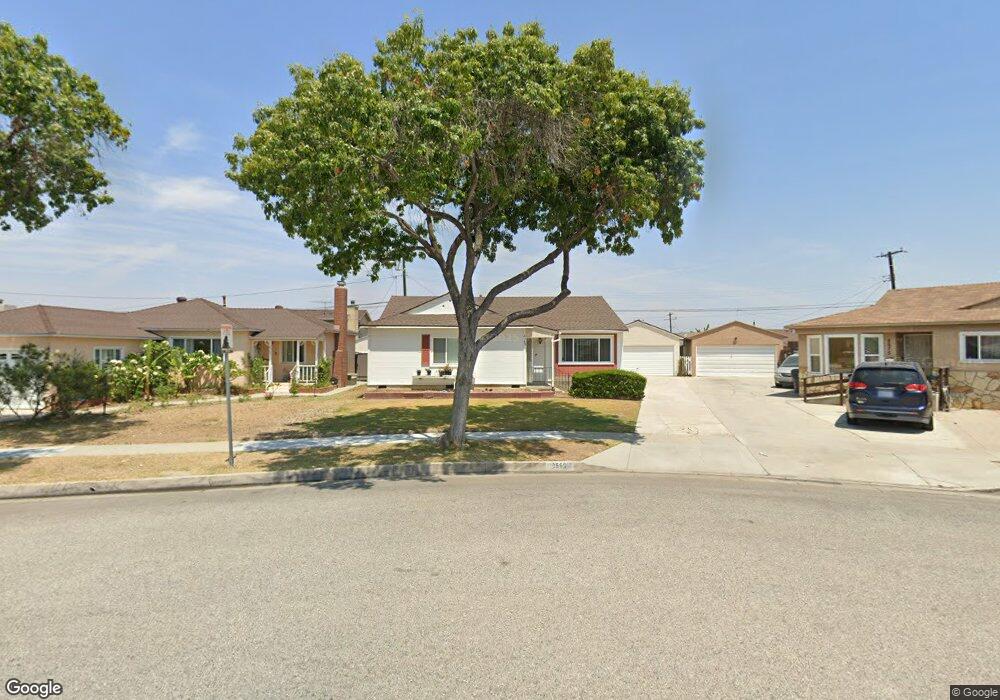
2569 Bomberry St Lakewood, CA 90712
Lakewood Mutual NeighborhoodEstimated Value: $868,000 - $949,000
3
Beds
2
Baths
1,567
Sq Ft
$578/Sq Ft
Est. Value
About This Home
This home is located at 2569 Bomberry St, Lakewood, CA 90712 and is currently estimated at $906,468, approximately $578 per square foot. 2569 Bomberry St is a home located in Los Angeles County with nearby schools including James Madison Elementary School, Hoover Middle School, and Lakewood High School.
Ownership History
Date
Name
Owned For
Owner Type
Purchase Details
Closed on
Oct 31, 2019
Sold by
Degraffenreid Karin and Johansen Karol A D
Bought by
Johansen Kjehl T and Johansen Karol A D
Current Estimated Value
Home Financials for this Owner
Home Financials are based on the most recent Mortgage that was taken out on this home.
Original Mortgage
$311,500
Interest Rate
3.5%
Mortgage Type
New Conventional
Purchase Details
Closed on
Jul 6, 2000
Sold by
Degraffenreid Charles W and Degraffenreid Susanne J
Bought by
Degraffenreid Charles W and Degraffenreid Susanne J
Create a Home Valuation Report for This Property
The Home Valuation Report is an in-depth analysis detailing your home's value as well as a comparison with similar homes in the area
Home Values in the Area
Average Home Value in this Area
Purchase History
| Date | Buyer | Sale Price | Title Company |
|---|---|---|---|
| Johansen Kjehl T | -- | Wfg National Title Co Of Ca | |
| Degraffenreid Charles W | -- | -- |
Source: Public Records
Mortgage History
| Date | Status | Borrower | Loan Amount |
|---|---|---|---|
| Previous Owner | Johansen Kjehl T | $311,500 |
Source: Public Records
Tax History Compared to Growth
Tax History
| Year | Tax Paid | Tax Assessment Tax Assessment Total Assessment is a certain percentage of the fair market value that is determined by local assessors to be the total taxable value of land and additions on the property. | Land | Improvement |
|---|---|---|---|---|
| 2025 | $5,208 | $383,461 | $258,786 | $124,675 |
| 2024 | $5,208 | $375,943 | $253,712 | $122,231 |
| 2023 | $5,121 | $368,573 | $248,738 | $119,835 |
| 2022 | $4,818 | $361,347 | $243,861 | $117,486 |
| 2021 | $1,477 | $82,206 | $23,525 | $58,681 |
| 2020 | $1,470 | $81,364 | $23,284 | $58,080 |
| 2019 | $1,453 | $79,770 | $22,828 | $56,942 |
| 2018 | $1,334 | $78,207 | $22,381 | $55,826 |
| 2016 | $1,224 | $75,172 | $21,513 | $53,659 |
| 2015 | $1,187 | $74,043 | $21,190 | $52,853 |
| 2014 | $1,186 | $72,593 | $20,775 | $51,818 |
Source: Public Records
Map
Nearby Homes
- 2729 Greentop St
- 2803 Frankel St
- 4328 Deeboyar Ave
- 4559 Levelside Ave
- 4700 Clair Del Ave Unit 538
- 3244 Centralia St
- 2523 Allred St
- 2912 Allred St
- 4155 Rose Ave
- 2922 Eckleson St
- 2912 Yearling St
- 4251 Gundry Ave
- 3638 Sandwood St
- 2739 Denmead St
- 3829 Cherry Ave
- 5016 Falcon Ave
- 4121 Country Club Dr
- 4944 Coke Ave
- 3746 Gardenia Ave
- 4196 4198 Del Mar Ave
- 2565 Bomberry St
- 2575 Bomberry St
- 2612 Greentop St
- 2608 Greentop St
- 2559 Bomberry St
- 2618 Greentop St
- 2602 Greentop St
- 4452 Maybank Ave
- 4449 Maybank Ave
- 2622 Greentop St
- 2532 Greentop St
- 2555 Bomberry St
- 4448 Maybank Ave
- 2528 Greentop St
- 4433 Paramount Blvd
- 4443 Maybank Ave
- 4427 Paramount Blvd
- 4439 Paramount Blvd
- 4458 Pixie Ave
- 4442 Maybank Ave