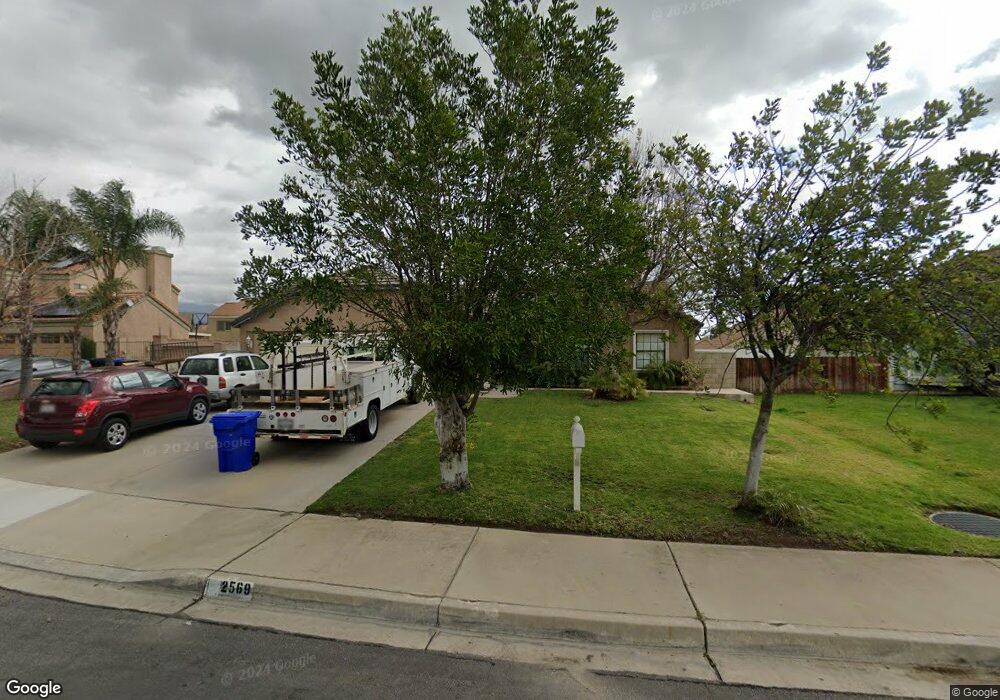
2569 N Quince Ave Rialto, CA 92377
Estimated Value: $584,000 - $690,000
3
Beds
2
Baths
1,502
Sq Ft
$415/Sq Ft
Est. Value
About This Home
This home is located at 2569 N Quince Ave, Rialto, CA 92377 and is currently estimated at $623,890, approximately $415 per square foot. 2569 N Quince Ave is a home located in San Bernardino County with nearby schools including Trapp Elementary School, Kolb Middle School, and Wilmer Amina Carter High School.
Ownership History
Date
Name
Owned For
Owner Type
Purchase Details
Closed on
Jun 24, 2015
Sold by
Olivares Grizel
Bought by
Olivares Grizel and Olivares Agustin
Current Estimated Value
Purchase Details
Closed on
Oct 29, 2010
Sold by
Federal Home Loan Mortgage Corporation
Bought by
Olivares Grizel
Home Financials for this Owner
Home Financials are based on the most recent Mortgage that was taken out on this home.
Original Mortgage
$160,788
Outstanding Balance
$106,410
Interest Rate
4.33%
Mortgage Type
FHA
Estimated Equity
$517,480
Purchase Details
Closed on
Jul 23, 2010
Sold by
Dearmond Christina
Bought by
Federal Home Loan Mortgage Corporation
Purchase Details
Closed on
Mar 5, 2008
Sold by
Dearmond Christina and De Armond Christine
Bought by
Dearmond Christina
Home Financials for this Owner
Home Financials are based on the most recent Mortgage that was taken out on this home.
Original Mortgage
$205,000
Interest Rate
5.65%
Mortgage Type
New Conventional
Create a Home Valuation Report for This Property
The Home Valuation Report is an in-depth analysis detailing your home's value as well as a comparison with similar homes in the area
Home Values in the Area
Average Home Value in this Area
Purchase History
| Date | Buyer | Sale Price | Title Company |
|---|---|---|---|
| Olivares Grizel | -- | None Available | |
| Olivares Grizel | $185,000 | Lps Default Title & Closing | |
| Federal Home Loan Mortgage Corporation | $166,106 | Accommodation | |
| Dearmond Christina | -- | First American Title Company |
Source: Public Records
Mortgage History
| Date | Status | Borrower | Loan Amount |
|---|---|---|---|
| Open | Olivares Grizel | $160,788 | |
| Previous Owner | Dearmond Christina | $205,000 |
Source: Public Records
Tax History Compared to Growth
Tax History
| Year | Tax Paid | Tax Assessment Tax Assessment Total Assessment is a certain percentage of the fair market value that is determined by local assessors to be the total taxable value of land and additions on the property. | Land | Improvement |
|---|---|---|---|---|
| 2025 | $3,715 | $270,620 | $96,087 | $174,533 |
| 2024 | $3,715 | $265,314 | $94,203 | $171,111 |
| 2023 | $3,933 | $260,112 | $92,356 | $167,756 |
| 2022 | $3,647 | $255,012 | $90,545 | $164,467 |
| 2021 | $3,626 | $250,012 | $88,770 | $161,242 |
| 2020 | $3,637 | $247,449 | $87,860 | $159,589 |
| 2019 | $3,563 | $242,597 | $86,137 | $156,460 |
| 2018 | $3,450 | $237,840 | $84,448 | $153,392 |
| 2017 | $3,427 | $233,176 | $82,792 | $150,384 |
| 2016 | $3,810 | $228,604 | $81,169 | $147,435 |
| 2015 | $3,067 | $225,170 | $79,950 | $145,220 |
| 2014 | $3,609 | $220,759 | $78,384 | $142,375 |
Source: Public Records
Map
Nearby Homes
- 2598 Ayala Dr Unit 34
- 1251 W Banyon St
- 1388 Nicholas Ct
- 2650 N Linden Ave
- 18464 Banyon Ave
- 2473 N Beechwood Ave
- 0 W Persimmon Ave
- 1569 W Summit Ave
- 5737 Riverside Ave
- 1520 W Norwood St
- 2425 N Fillmore Ave
- 5651 Magnolia Ave
- 1122 W Galway St
- 8139 N Maple Ave
- 1074 W Casmalia St
- 5874 Olive Ave
- 1770 W Candlewood Ave
- 19244 Casmalia St
- 5862 Geremander Ave
- 580 Bridgeport Dr
- 2559 N Quince Ave
- 2579 N Quince Ave
- 2578 N Church Ave
- 2588 N Church Ave
- 2568 N Church Ave
- 2549 N Quince Ave
- 2572 N Quince Ave
- 2562 N Quince Ave
- 2591 N Quince Ave
- 2558 N Church Ave
- 2598 N Church Ave
- 2582 N Quince Ave
- 2552 N Quince Ave
- 2592 N Quince Ave
- 2539 N Quince Ave
- 2548 N Church Ave
- 2573 N Church Ave
- 2583 N Church Ave
- 2542 N Quince Ave
- 2595 N Church Ave