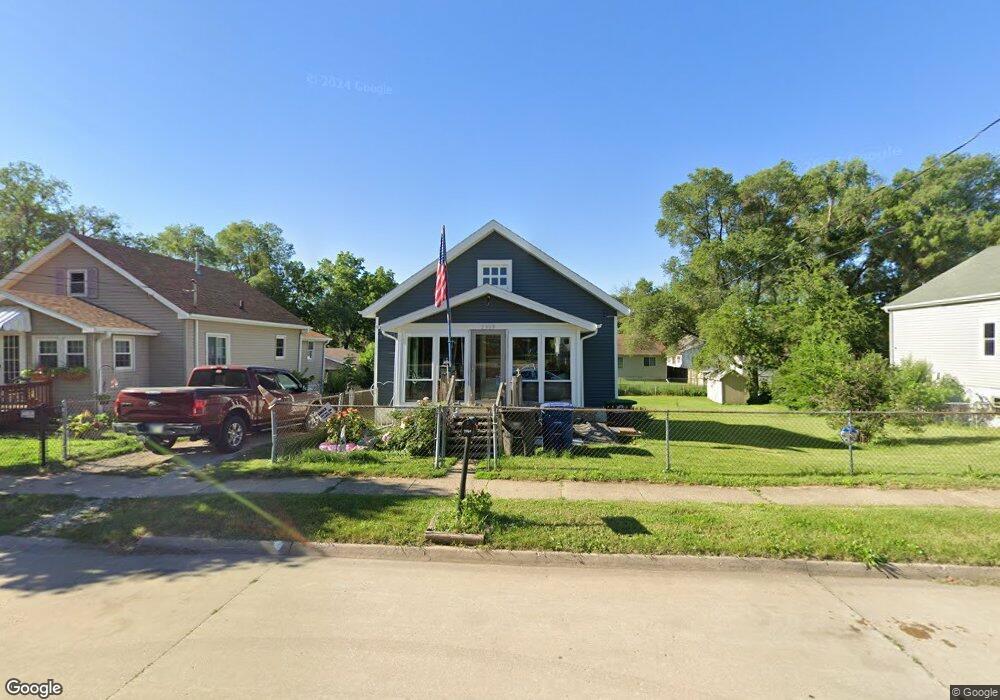
2569 Onawa St Des Moines, IA 50317
Chesterfield NeighborhoodEstimated Value: $58,000 - $102,000
1
Bed
1
Bath
624
Sq Ft
$139/Sq Ft
Est. Value
About This Home
This home is located at 2569 Onawa St, Des Moines, IA 50317 and is currently estimated at $87,023, approximately $139 per square foot. 2569 Onawa St is a home located in Polk County with nearby schools including Willard Elementary School, Hoyt Middle School, and East High School.
Ownership History
Date
Name
Owned For
Owner Type
Purchase Details
Closed on
Sep 9, 2021
Sold by
Coluzzi Construction Llc
Bought by
Overton Linda and Brumbaugh Edward
Current Estimated Value
Purchase Details
Closed on
Jul 14, 2020
Sold by
Renslow Douglas J and Renslow Amber
Bought by
Coluzzi Construction Llc
Home Financials for this Owner
Home Financials are based on the most recent Mortgage that was taken out on this home.
Original Mortgage
$25,150
Interest Rate
3.1%
Mortgage Type
Future Advance Clause Open End Mortgage
Create a Home Valuation Report for This Property
The Home Valuation Report is an in-depth analysis detailing your home's value as well as a comparison with similar homes in the area
Home Values in the Area
Average Home Value in this Area
Purchase History
| Date | Buyer | Sale Price | Title Company |
|---|---|---|---|
| Overton Linda | $48,000 | Hubbard Law Firm Pc | |
| Coluzzi Construction Llc | $29,500 | None Available |
Source: Public Records
Mortgage History
| Date | Status | Borrower | Loan Amount |
|---|---|---|---|
| Previous Owner | Coluzzi Construction Llc | $25,150 |
Source: Public Records
Tax History Compared to Growth
Tax History
| Year | Tax Paid | Tax Assessment Tax Assessment Total Assessment is a certain percentage of the fair market value that is determined by local assessors to be the total taxable value of land and additions on the property. | Land | Improvement |
|---|---|---|---|---|
| 2025 | $712 | $71,900 | $8,700 | $63,200 |
| 2024 | $712 | $62,300 | $7,500 | $54,800 |
| 2023 | $970 | $62,300 | $7,500 | $54,800 |
| 2022 | $960 | $53,400 | $6,600 | $46,800 |
| 2021 | $866 | $53,400 | $6,600 | $46,800 |
| 2020 | $892 | $46,600 | $5,800 | $40,800 |
| 2019 | $764 | $46,600 | $5,800 | $40,800 |
| 2018 | $748 | $40,200 | $5,000 | $35,200 |
| 2017 | $1,042 | $40,200 | $5,000 | $35,200 |
| 2016 | $1,014 | $38,500 | $4,700 | $33,800 |
| 2015 | $1,014 | $38,500 | $4,700 | $33,800 |
| 2014 | $978 | $38,200 | $4,600 | $33,600 |
Source: Public Records
Map
Nearby Homes