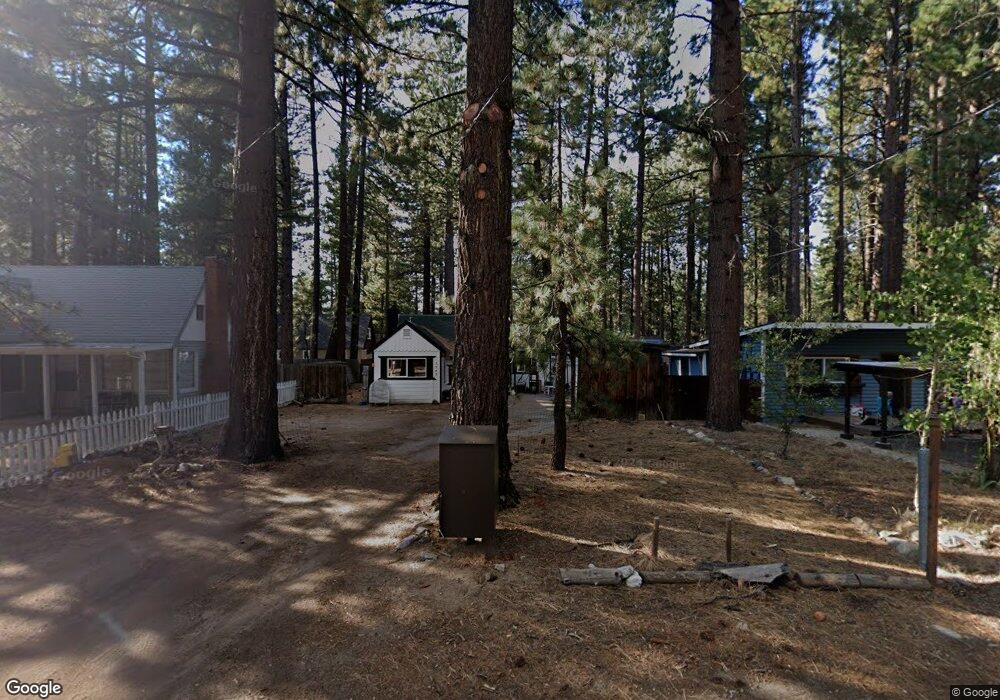
2569 Osborne Ave South Lake Tahoe, CA 96150
Estimated Value: $387,499 - $521,000
2
Beds
1
Bath
847
Sq Ft
$537/Sq Ft
Est. Value
About This Home
This home is located at 2569 Osborne Ave, South Lake Tahoe, CA 96150 and is currently estimated at $455,125, approximately $537 per square foot. 2569 Osborne Ave is a home located in El Dorado County with nearby schools including Tahoe Valley Elementary School, South Tahoe Middle School, and South Tahoe High School.
Ownership History
Date
Name
Owned For
Owner Type
Purchase Details
Closed on
Jun 27, 2008
Sold by
Aronoff Arte
Bought by
Aronoff Lloyd
Current Estimated Value
Home Financials for this Owner
Home Financials are based on the most recent Mortgage that was taken out on this home.
Original Mortgage
$125,000
Outstanding Balance
$80,354
Interest Rate
6%
Mortgage Type
New Conventional
Estimated Equity
$374,771
Purchase Details
Closed on
Jul 29, 1999
Sold by
Aronoff Eda and Aronoff Lloyd
Bought by
Aronoff Lloyd
Create a Home Valuation Report for This Property
The Home Valuation Report is an in-depth analysis detailing your home's value as well as a comparison with similar homes in the area
Home Values in the Area
Average Home Value in this Area
Purchase History
| Date | Buyer | Sale Price | Title Company |
|---|---|---|---|
| Aronoff Lloyd | -- | Old Republic Title Company | |
| Aronoff Lloyd | $20,000 | Fidelity National Title Co |
Source: Public Records
Mortgage History
| Date | Status | Borrower | Loan Amount |
|---|---|---|---|
| Open | Aronoff Lloyd | $125,000 |
Source: Public Records
Tax History Compared to Growth
Tax History
| Year | Tax Paid | Tax Assessment Tax Assessment Total Assessment is a certain percentage of the fair market value that is determined by local assessors to be the total taxable value of land and additions on the property. | Land | Improvement |
|---|---|---|---|---|
| 2025 | $964 | $83,325 | $18,246 | $65,079 |
| 2024 | $964 | $81,692 | $17,889 | $63,803 |
| 2023 | $1,530 | $80,091 | $17,539 | $62,552 |
| 2022 | $939 | $78,522 | $17,196 | $61,326 |
| 2021 | $1,502 | $76,983 | $16,859 | $60,124 |
| 2020 | $913 | $76,195 | $16,687 | $59,508 |
| 2019 | $1,884 | $74,702 | $16,360 | $58,342 |
| 2018 | $890 | $73,239 | $16,040 | $57,199 |
| 2017 | $1,736 | $71,804 | $15,726 | $56,078 |
| 2016 | $860 | $70,397 | $15,418 | $54,979 |
| 2015 | $1,229 | $69,342 | $15,188 | $54,154 |
| 2014 | $2,023 | $67,987 | $14,892 | $53,095 |
Source: Public Records
Map
Nearby Homes
- 2561 Osborne Ave
- 1182 Reno Ave
- 2539 Knox Ave
- 2525 Knox Ave
- 2573 Rose Ave
- 2612 Alma Ave
- 1078 Reno Ave
- 2515 Rose Ave
- 2605 Elwood Ave
- 2560 Pinter Ave
- 2575 Fountain Ave
- 2613 Fountain Ave
- 2600 Fountain Ave
- 2684 Knox Ave
- 2687 Knox Ave
- 2645 Fountain Ave
- 2605 Chris Ave
- 2468 Rose Ave
- 1116 Lindberg Ave
- 2634 Chris Ave
- 2565 Osborne Ave
- 2573 Osborne Ave
- 2579 Osborne Ave
- 2566 Bertha Ave
- 2572 Bertha Ave
- 2561 Osborne Ave Unit 1-5
- 2568 Osborne Ave
- 2576 Bertha Ave
- 2572 Osborne Ave
- 2564 Osborne Ave
- 2581 Osborne Ave
- 2560 Bertha Ave
- 2576 Osborne Ave
- 2580 Bertha Ave
- 2580 Osborne Ave
- 1146 Reno Ave
- 2571 Bertha Ave
- 1144 Reno Ave
- 2569 Kubel Ave
- 2567 Bertha Ave