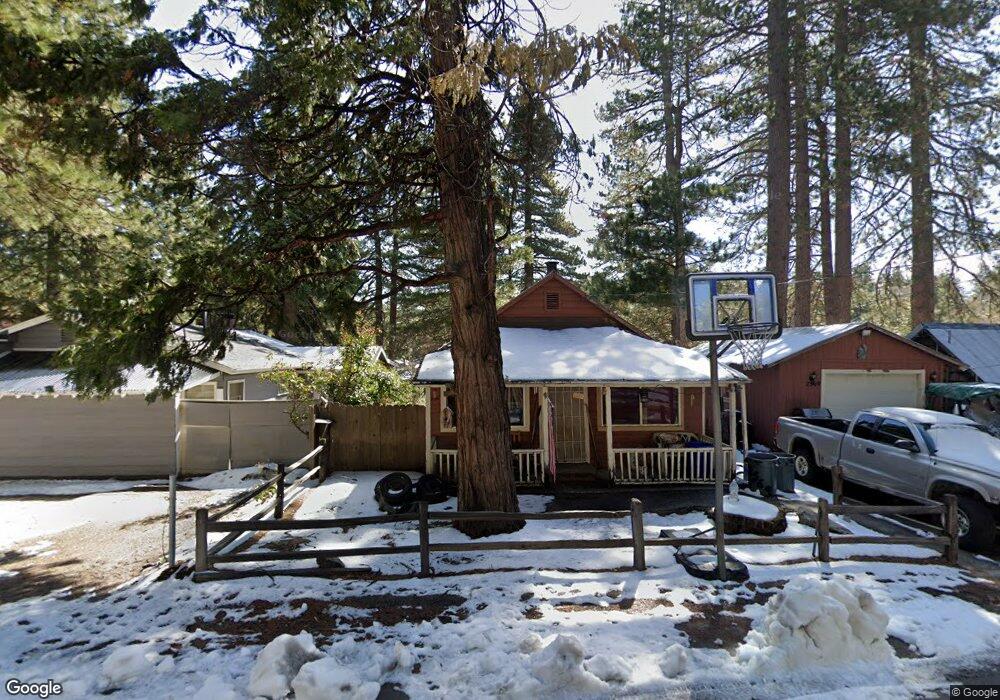
2569 Palo Alto Way Running Springs, CA 92382
Estimated Value: $287,613 - $340,000
2
Beds
1
Bath
1,168
Sq Ft
$269/Sq Ft
Est. Value
About This Home
This home is located at 2569 Palo Alto Way, Running Springs, CA 92382 and is currently estimated at $314,153, approximately $268 per square foot. 2569 Palo Alto Way is a home with nearby schools including Charles Hoffman Elementary School, Mary P. Henck Intermediate School, and Rim Of The World Senior High School.
Ownership History
Date
Name
Owned For
Owner Type
Purchase Details
Closed on
Feb 27, 2004
Sold by
Bailey James D and Bailey Kendra C
Bought by
Bailey James D and Bailey Kendra C
Current Estimated Value
Purchase Details
Closed on
Sep 25, 2003
Sold by
Bailey James D and Bailey Kendra C
Bought by
Bailey James D
Home Financials for this Owner
Home Financials are based on the most recent Mortgage that was taken out on this home.
Original Mortgage
$79,000
Interest Rate
6.22%
Mortgage Type
Purchase Money Mortgage
Purchase Details
Closed on
Apr 21, 2003
Sold by
Bailey James D and Bailey Kendia C
Bought by
Bailey James D and Bailey Kendia C
Purchase Details
Closed on
Apr 12, 2002
Sold by
Bailey James D
Bought by
Bailey James D
Purchase Details
Closed on
Nov 13, 1995
Sold by
Altieri Marie L
Bought by
Bailey James D
Create a Home Valuation Report for This Property
The Home Valuation Report is an in-depth analysis detailing your home's value as well as a comparison with similar homes in the area
Home Values in the Area
Average Home Value in this Area
Purchase History
| Date | Buyer | Sale Price | Title Company |
|---|---|---|---|
| Bailey James D | -- | -- | |
| Bailey James D | -- | Landsafe | |
| Bailey James D | -- | -- | |
| Bailey James D | -- | -- | |
| Bailey James D | -- | -- |
Source: Public Records
Mortgage History
| Date | Status | Borrower | Loan Amount |
|---|---|---|---|
| Closed | Bailey James D | $79,000 |
Source: Public Records
Tax History Compared to Growth
Tax History
| Year | Tax Paid | Tax Assessment Tax Assessment Total Assessment is a certain percentage of the fair market value that is determined by local assessors to be the total taxable value of land and additions on the property. | Land | Improvement |
|---|---|---|---|---|
| 2025 | $1,244 | $83,061 | $8,305 | $74,756 |
| 2024 | $1,244 | $81,432 | $8,142 | $73,290 |
| 2023 | $1,232 | $79,835 | $7,982 | $71,853 |
| 2022 | $1,213 | $78,269 | $7,825 | $70,444 |
| 2021 | $1,202 | $76,735 | $7,672 | $69,063 |
| 2020 | $1,202 | $75,948 | $7,593 | $68,355 |
| 2019 | $1,178 | $74,459 | $7,444 | $67,015 |
| 2018 | $1,124 | $72,999 | $7,298 | $65,701 |
| 2017 | $1,108 | $71,568 | $7,155 | $64,413 |
| 2016 | $1,081 | $70,165 | $7,015 | $63,150 |
| 2015 | $1,072 | $69,111 | $6,910 | $62,201 |
| 2014 | $1,057 | $67,758 | $6,775 | $60,983 |
Source: Public Records
Map
Nearby Homes
- 2524 Spring Dr
- 2544 Spring Dr
- 2500 Spring Dr
- 2557 Whispering Pines Dr
- 2493 Palo Alto Way
- 2600 Whispering Pines Dr
- 32079 Fern Dr
- 2463 Palo Alto Way
- 32068 Hunsaker Way
- 2548 Secret Dr
- 32065 Hunsaker Way Unit 12
- 2405 Whispering Pines Dr
- 31867 Wagon Wheel Dr
- 31816 Silver Spruce Dr
- 0 California 18
- 31805 Luring Pines Dr
- 2726 View Dr
- 2344 Deep Creek Dr
- 0 Deep Creek Dr
- 2395 Hunsaker Dr
- 2577 Palo Alto Way
- 31981 Edison Way
- 31995 Edison Way
- 2564 Palo Alto Way
- 2561 Spring Dr
- 2545 Palo Alto Way
- 2552 Palo Alto Way
- 31994 Edison Way
- 2564 Spring Dr
- 32000 Edison Way
- 2538 Palo Alto Way
- 2554 Spring Dr
- 2551 Spring Dr
- 2537 Spring Dr
- 2529 Spring Dr
- 2525 Palo Alto Way
- 2526 Palo Alto Way
- 2525 Spring Dr
- 2609 Whispering Pines Dr