Estimated Value: $502,000 - $701,000
4
Beds
3
Baths
2,245
Sq Ft
$267/Sq Ft
Est. Value
About This Home
This home is located at 2569 Rolling Meadows, Xenia, OH 45385 and is currently estimated at $598,474, approximately $266 per square foot. 2569 Rolling Meadows is a home located in Greene County with nearby schools including Trebein Elementary School, Jacob Coy Middle School, and Beavercreek High School.
Ownership History
Date
Name
Owned For
Owner Type
Purchase Details
Closed on
Aug 22, 2014
Sold by
Sims Bradley J and Sims Pamela S
Bought by
Grah Allan
Current Estimated Value
Purchase Details
Closed on
Nov 15, 2010
Sold by
Mcgatha Joseph L and Mcgatha Loretta M
Bought by
Sims Bradley J
Home Financials for this Owner
Home Financials are based on the most recent Mortgage that was taken out on this home.
Original Mortgage
$273,700
Interest Rate
4.22%
Mortgage Type
VA
Purchase Details
Closed on
Oct 29, 1999
Sold by
Laverne Sinclair and Laverne Laverene
Bought by
Mcgatha Joseph L and Mcgatha Loretta M
Home Financials for this Owner
Home Financials are based on the most recent Mortgage that was taken out on this home.
Original Mortgage
$150,000
Interest Rate
6.37%
Create a Home Valuation Report for This Property
The Home Valuation Report is an in-depth analysis detailing your home's value as well as a comparison with similar homes in the area
Home Values in the Area
Average Home Value in this Area
Purchase History
| Date | Buyer | Sale Price | Title Company |
|---|---|---|---|
| Grah Allan | $325,000 | None Available | |
| Sims Bradley J | $265,000 | Attorney | |
| Mcgatha Joseph L | $210,000 | -- |
Source: Public Records
Mortgage History
| Date | Status | Borrower | Loan Amount |
|---|---|---|---|
| Previous Owner | Sims Bradley J | $273,700 | |
| Previous Owner | Mcgatha Joseph L | $150,000 |
Source: Public Records
Tax History Compared to Growth
Tax History
| Year | Tax Paid | Tax Assessment Tax Assessment Total Assessment is a certain percentage of the fair market value that is determined by local assessors to be the total taxable value of land and additions on the property. | Land | Improvement |
|---|---|---|---|---|
| 2024 | $8,247 | $143,600 | $32,610 | $110,990 |
| 2023 | $8,247 | $143,600 | $32,610 | $110,990 |
| 2022 | $7,492 | $114,370 | $27,180 | $87,190 |
| 2021 | $7,566 | $114,370 | $27,180 | $87,190 |
| 2020 | $7,603 | $114,370 | $27,180 | $87,190 |
| 2019 | $7,394 | $102,150 | $24,090 | $78,060 |
| 2018 | $6,465 | $102,150 | $24,090 | $78,060 |
| 2017 | $6,344 | $102,150 | $24,090 | $78,060 |
| 2016 | $6,102 | $95,090 | $24,090 | $71,000 |
| 2015 | $6,141 | $95,090 | $24,090 | $71,000 |
| 2014 | $6,002 | $95,090 | $24,090 | $71,000 |
Source: Public Records
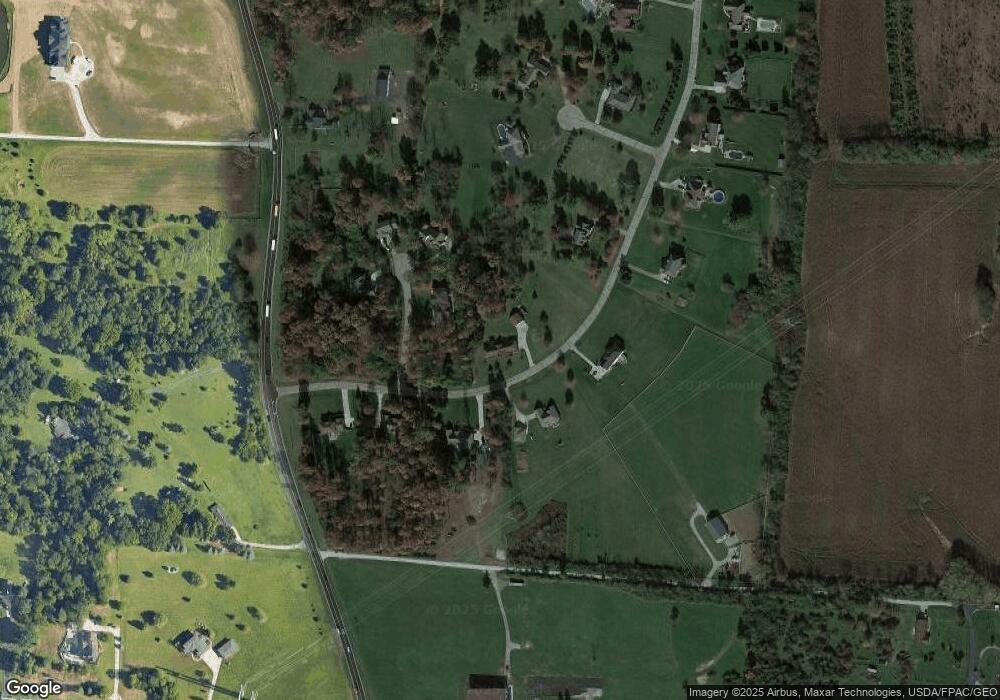
Map
Nearby Homes
- 1800 Ash Meadow Ct
- 1878 Spring Meadows Dr
- 1281 Whitetail Dr
- 1922 Spring Ridge Dr
- 1788 Fawnwood Ct
- 1105 Windsong Trail
- 1481 Stone Ridge Ct
- 2068 Creswell Dr
- 2447 Hawes Dr
- 2450 Beaver Valley Rd
- 1395 Brookstone Dr
- Hudson Plan at Nathanials Grove Estates
- Cumberland Plan at Nathanials Grove Estates
- Lehigh Plan at Nathanials Grove Estates
- Ballenger Plan at Nathanials Grove Estates
- Aviano Plan at Nathanials Grove Estates
- Allegheny Plan at Nathanials Grove Estates
- 508 Glenhaven Way Unit 756-300
- 516 Glenhaven Way Unit 756-304
- 506 Glenhaven Way Unit 756-204
- 2570 Summerwood Ct
- 2554 Rolling Meadows
- 2548 Rolling Meadows
- 2572 Rolling Meadows
- 2542 Rolling Meadows
- 2588 Summerwood Ct
- 2597 Rolling Meadows
- 2589 Summerwood Ct
- 2581 Summerwood Ct
- 2598 Rolling Meadows
- 2536 Rolling Meadows
- 1573 Still Meadow Ct
- 2616 Rolling Meadows
- 0 Summerwood Ct Unit 415544
- 0 Summerwood Ct Unit 866580
- 1570 Still Meadow Ct
- 2584 Trebein Rd
- 1556 Still Meadow Ct
- 2630 Rolling Meadows
- 2521 Trebein Rd