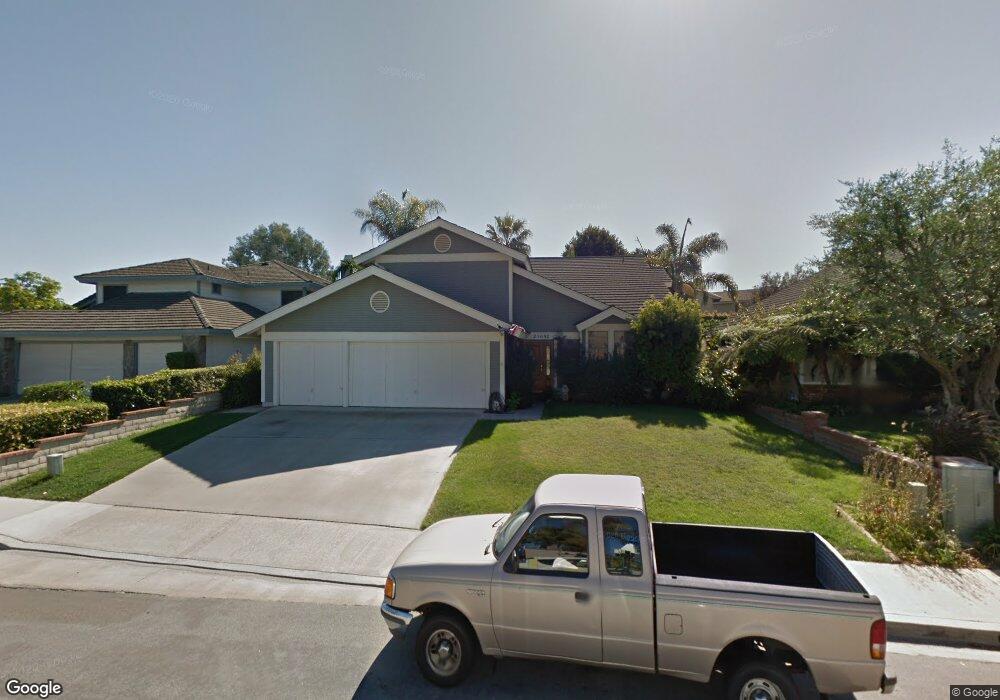
25692 Rusty Anchor St Dana Point, CA 92629
Del Obispo NeighborhoodEstimated Value: $1,938,765 - $2,601,000
4
Beds
4
Baths
2,730
Sq Ft
$782/Sq Ft
Est. Value
About This Home
This home is located at 25692 Rusty Anchor St, Dana Point, CA 92629 and is currently estimated at $2,135,691, approximately $782 per square foot. 25692 Rusty Anchor St is a home located in Orange County with nearby schools including Del Obispo Elementary School, Marco Forster Middle School, and Dana Hills High School.
Ownership History
Date
Name
Owned For
Owner Type
Purchase Details
Closed on
Oct 8, 2012
Sold by
Leong Robert and Leong Karen
Bought by
Leong Karen
Current Estimated Value
Home Financials for this Owner
Home Financials are based on the most recent Mortgage that was taken out on this home.
Original Mortgage
$255,000
Outstanding Balance
$177,161
Interest Rate
3.58%
Mortgage Type
New Conventional
Estimated Equity
$1,958,530
Purchase Details
Closed on
Jan 18, 2008
Sold by
Leong Robert
Bought by
Leong Karen
Purchase Details
Closed on
Nov 9, 1995
Sold by
Heller David J and Heller Debra Lynn
Bought by
Leong Robert and Leong Karen
Home Financials for this Owner
Home Financials are based on the most recent Mortgage that was taken out on this home.
Original Mortgage
$179,200
Interest Rate
7.25%
Create a Home Valuation Report for This Property
The Home Valuation Report is an in-depth analysis detailing your home's value as well as a comparison with similar homes in the area
Home Values in the Area
Average Home Value in this Area
Purchase History
| Date | Buyer | Sale Price | Title Company |
|---|---|---|---|
| Leong Karen | -- | Calcounties Title Nation | |
| Leong Karen | -- | None Available | |
| Leong Robert | $224,000 | Continental Lawyers Title Co |
Source: Public Records
Mortgage History
| Date | Status | Borrower | Loan Amount |
|---|---|---|---|
| Open | Leong Karen | $255,000 | |
| Previous Owner | Leong Robert | $179,200 |
Source: Public Records
Tax History
| Year | Tax Paid | Tax Assessment Tax Assessment Total Assessment is a certain percentage of the fair market value that is determined by local assessors to be the total taxable value of land and additions on the property. | Land | Improvement |
|---|---|---|---|---|
| 2025 | $6,695 | $460,257 | $138,383 | $321,874 |
| 2024 | $6,695 | $451,233 | $135,670 | $315,563 |
| 2023 | $6,203 | $442,386 | $133,010 | $309,376 |
| 2022 | $5,684 | $433,712 | $130,402 | $303,310 |
| 2021 | $5,162 | $425,208 | $127,845 | $297,363 |
| 2020 | $5,143 | $420,849 | $126,535 | $294,314 |
| 2019 | $4,927 | $412,598 | $124,054 | $288,544 |
| 2018 | $4,806 | $404,508 | $121,621 | $282,887 |
| 2017 | $4,680 | $396,577 | $119,236 | $277,341 |
| 2016 | $4,556 | $388,801 | $116,898 | $271,903 |
| 2015 | $4,520 | $382,961 | $115,142 | $267,819 |
| 2014 | $4,529 | $375,460 | $112,887 | $262,573 |
Source: Public Records
Map
Nearby Homes
- 25592 Goldenspring Dr
- 25501 Goldenspring Dr
- 0 Stonehill Dr Unit OC25264877
- 33162 Paseo Pinto
- 33041 Lighthouse Ct
- 25262 Brigantine Dr
- 16 Lapis Ave
- 33042 Palo Alto St
- 33211 Blue Fin Dr
- 33831 Camino Capistrano Unit 50
- 33831 Camino Capistrano Unit 19
- 33231 Big Sur St
- 26000 Avenida Aeropuerto Unit 12
- 25422 Sea Bluffs Dr Unit 103
- 25432 Sea Bluffs Dr Unit 302
- 32791 Del Obispo St
- 34052 Capistrano by The Sea
- 33891 Calle la Primavera Unit 33891
- 33911 Calle la Primavera
- 26311 Paseo Armonia
- 25682 Rusty Anchor St
- 25702 Rusty Anchor St
- 33501 Nancy Jane Ct
- 25672 Rusty Anchor St
- 25712 Rusty Anchor St
- 24645 Goldenspring Dr
- 33511 Nancy Jane Ct
- 33452 Surf Shoal Place
- 33461 Cape Bay Place
- 33502 Sunridge Dr
- 25641 Goldenspring Dr
- 25662 Rusty Anchor St
- 25722 Rusty Anchor St
- 33521 Nancy Jane Ct
- 33451 Cape Bay Place
- 33512 Sunridge Dr
- 33442 Surf Shoal Place
- 25631 Goldenspring Dr
- 33502 Nancy Jane Ct
- 33445 Surf Shoal Place
Your Personal Tour Guide
Ask me questions while you tour the home.