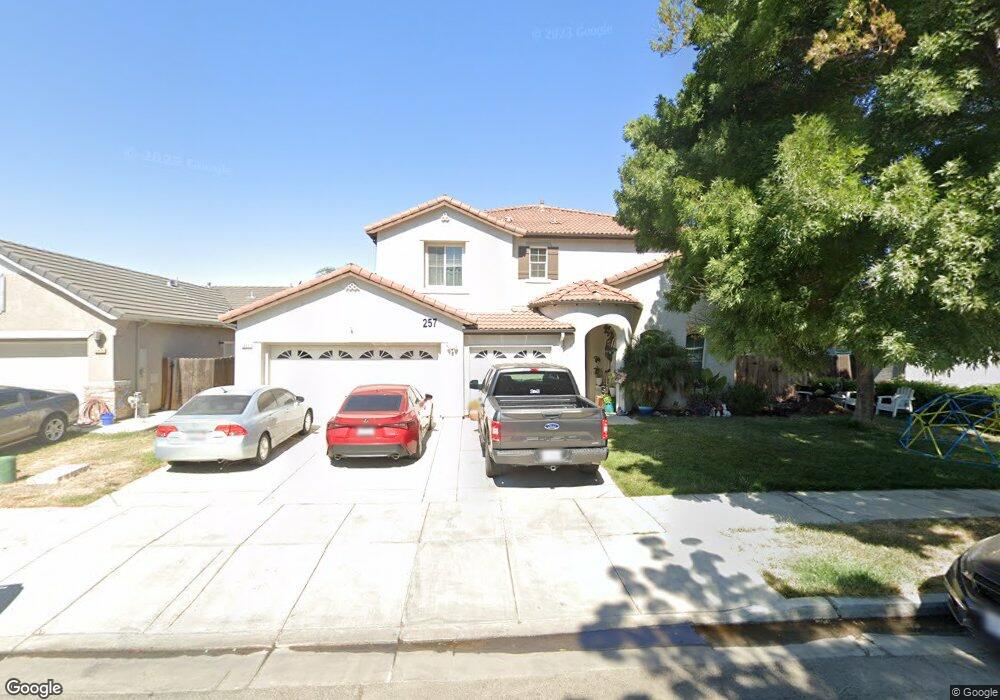
257 Honeybell Ct Los Banos, CA 93635
Estimated Value: $547,000 - $646,000
3
Beds
4
Baths
2,687
Sq Ft
$215/Sq Ft
Est. Value
About This Home
This home is located at 257 Honeybell Ct, Los Banos, CA 93635 and is currently estimated at $577,791, approximately $215 per square foot. 257 Honeybell Ct is a home located in Merced County with nearby schools including Los Banos Elementary School, Los Banos Junior High School, and Pacheco High School.
Ownership History
Date
Name
Owned For
Owner Type
Purchase Details
Closed on
Feb 1, 2023
Sold by
Garcia Enrique Rojas
Bought by
Valenzuela Jose and Valenzuela Marie
Current Estimated Value
Purchase Details
Closed on
Sep 9, 2016
Sold by
Valenzuela Jose and Valenzuela Maria
Bought by
Garcia Enrique Rojas
Home Financials for this Owner
Home Financials are based on the most recent Mortgage that was taken out on this home.
Original Mortgage
$306,450
Interest Rate
3.45%
Mortgage Type
VA
Purchase Details
Closed on
May 31, 2006
Sold by
Orchard Terrace Estates Llc
Bought by
Valenzuela Jose and Valenzuela Maria
Home Financials for this Owner
Home Financials are based on the most recent Mortgage that was taken out on this home.
Original Mortgage
$463,504
Interest Rate
7.12%
Mortgage Type
Purchase Money Mortgage
Create a Home Valuation Report for This Property
The Home Valuation Report is an in-depth analysis detailing your home's value as well as a comparison with similar homes in the area
Home Values in the Area
Average Home Value in this Area
Purchase History
| Date | Buyer | Sale Price | Title Company |
|---|---|---|---|
| Valenzuela Jose | $272,500 | -- | |
| Garcia Enrique Rojas | $300,000 | First American Title Company | |
| Valenzuela Jose | $579,500 | Fidelity Natl Title Co Of Ca |
Source: Public Records
Mortgage History
| Date | Status | Borrower | Loan Amount |
|---|---|---|---|
| Previous Owner | Garcia Enrique Rojas | $306,450 | |
| Previous Owner | Valenzuela Jose | $463,504 |
Source: Public Records
Tax History Compared to Growth
Tax History
| Year | Tax Paid | Tax Assessment Tax Assessment Total Assessment is a certain percentage of the fair market value that is determined by local assessors to be the total taxable value of land and additions on the property. | Land | Improvement |
|---|---|---|---|---|
| 2025 | $4,510 | $348,169 | $69,632 | $278,537 |
| 2024 | $4,510 | $341,343 | $68,267 | $273,076 |
| 2023 | $4,256 | $334,651 | $66,929 | $267,722 |
| 2022 | $4,162 | $328,090 | $65,617 | $262,473 |
| 2021 | $4,093 | $321,658 | $64,331 | $257,327 |
| 2020 | $4,040 | $318,361 | $63,672 | $254,689 |
| 2019 | $3,957 | $312,120 | $62,424 | $249,696 |
| 2018 | $3,836 | $306,000 | $61,200 | $244,800 |
| 2017 | $3,780 | $300,000 | $60,000 | $240,000 |
| 2016 | $4,331 | $335,000 | $55,000 | $280,000 |
| 2015 | $3,849 | $295,000 | $60,000 | $235,000 |
| 2014 | $3,388 | $257,000 | $30,000 | $227,000 |
Source: Public Records
Map
Nearby Homes
- 355 Chestnut St
- 20176 Overland Rd
- 127 Willmott Ave
- 0 Illinois Ave Unit 225094934
- 725 Nevada Ave
- 341 Lime Ave
- 410 Orange Ave
- 475 Santa Barbara St
- 450 Orange Ave
- 830 Auction St
- 0 W I St Unit ML81999689
- 204 North St
- 233 W I St
- 133 W I St
- 860 Fritz Dr
- 601 Betten St
- 625 Betten St
- 255 Birchwood Ave
- 316 Rosalie Ct
- 737 Betten St
- 249 Honeybell Ct
- 265 Honeybell St
- 249 Honeybell St
- 273 Honeybell St
- 241 Honeybell Ct
- 258 Honeybell Ct
- 250 Honeybell Ct
- 264 Honeybell Ct
- 281 Honeybell St
- 233 Honeybell Ct
- 242 Honeybell Ct
- 234 Honeybell Ct
- 225 Honeybell Ct
- 301 Honeybell St
- 259 Sunburst St
- 253 Sunburst St
- 267 Sunburst St
- 226 Honeybell Ct
- 243 Sunburst St
- 309 Honeybell St