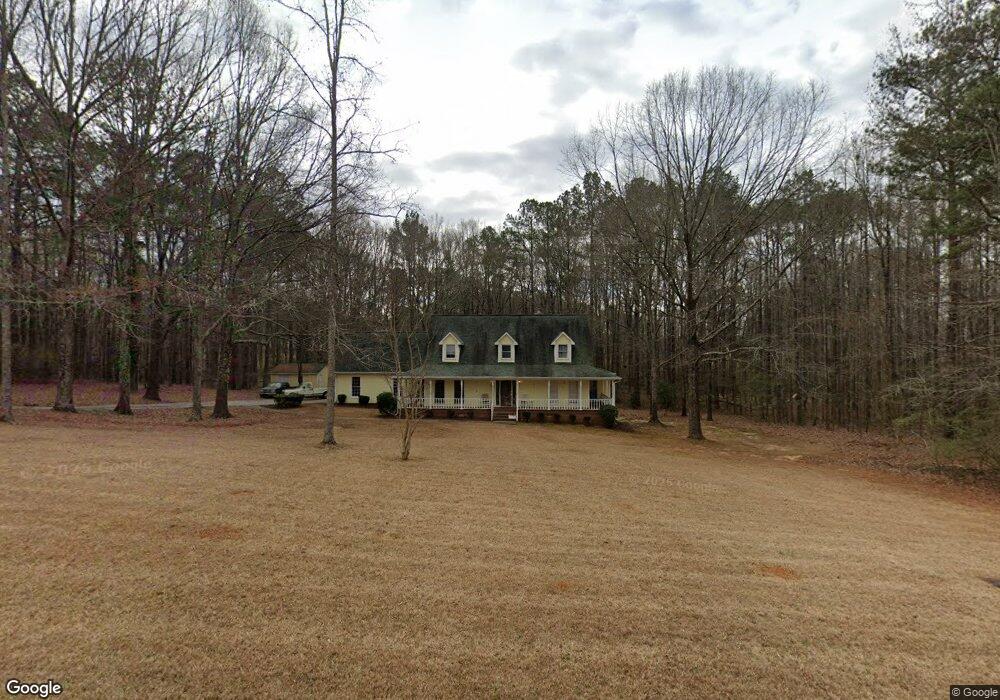
257 Hoppin Branch Rd Griffin, GA 30224
Spalding County NeighborhoodEstimated Value: $348,462 - $417,000
3
Beds
3
Baths
2,860
Sq Ft
$135/Sq Ft
Est. Value
About This Home
This home is located at 257 Hoppin Branch Rd, Griffin, GA 30224 and is currently estimated at $384,866, approximately $134 per square foot. 257 Hoppin Branch Rd is a home located in Spalding County with nearby schools including Crescent Road Elementary School, Rehoboth Road Middle School, and Spalding High School.
Ownership History
Date
Name
Owned For
Owner Type
Purchase Details
Closed on
Mar 20, 2003
Sold by
Nylund Kirk L and Nylund Cheryl A
Bought by
Kirby David W and Kirby Wendi M
Current Estimated Value
Home Financials for this Owner
Home Financials are based on the most recent Mortgage that was taken out on this home.
Original Mortgage
$179,450
Outstanding Balance
$77,033
Interest Rate
5.86%
Mortgage Type
New Conventional
Estimated Equity
$307,833
Purchase Details
Closed on
Nov 15, 1989
Sold by
Solomon Gordon J and Solomon Wanda L
Bought by
Lynch James D and Lynch Linda T
Purchase Details
Closed on
Jan 17, 1986
Sold by
Commercial Bank & Trust Co
Bought by
Solomon Gordon J and Solomon Wanda L
Purchase Details
Closed on
Apr 20, 1982
Sold by
Smith Fred R
Bought by
Commercial Bank & Trust Co
Purchase Details
Closed on
Nov 8, 1977
Sold by
Smith Fred R Etal
Bought by
Smith Fred R
Purchase Details
Closed on
Dec 16, 1975
Sold by
Smith Dan J
Bought by
Smith Fred R Etal
Purchase Details
Closed on
Apr 14, 1973
Sold by
Shapard Thomas L
Bought by
Smith Dan J
Create a Home Valuation Report for This Property
The Home Valuation Report is an in-depth analysis detailing your home's value as well as a comparison with similar homes in the area
Home Values in the Area
Average Home Value in this Area
Purchase History
| Date | Buyer | Sale Price | Title Company |
|---|---|---|---|
| Kirby David W | $185,000 | -- | |
| Lynch James D | $6,800 | -- | |
| Solomon Gordon J | $8,800 | -- | |
| Commercial Bank & Trust Co | $11,000 | -- | |
| Smith Fred R | $9,900 | -- | |
| Smith Fred R Etal | -- | -- | |
| Smith Dan J | -- | -- |
Source: Public Records
Mortgage History
| Date | Status | Borrower | Loan Amount |
|---|---|---|---|
| Open | Kirby David W | $179,450 |
Source: Public Records
Tax History Compared to Growth
Tax History
| Year | Tax Paid | Tax Assessment Tax Assessment Total Assessment is a certain percentage of the fair market value that is determined by local assessors to be the total taxable value of land and additions on the property. | Land | Improvement |
|---|---|---|---|---|
| 2024 | $3,843 | $110,398 | $12,000 | $98,398 |
| 2023 | $3,885 | $110,398 | $12,000 | $98,398 |
| 2022 | $3,540 | $99,150 | $12,000 | $87,150 |
| 2021 | $2,832 | $79,689 | $12,000 | $67,689 |
| 2020 | $2,842 | $79,689 | $12,000 | $67,689 |
| 2019 | $2,899 | $79,689 | $12,000 | $67,689 |
| 2018 | $2,763 | $74,133 | $12,000 | $62,133 |
| 2017 | $2,689 | $74,133 | $12,000 | $62,133 |
| 2016 | $2,737 | $74,133 | $12,000 | $62,133 |
| 2015 | $2,820 | $74,133 | $12,000 | $62,133 |
| 2014 | $2,876 | $74,133 | $12,000 | $62,133 |
Source: Public Records
Map
Nearby Homes
- 55 Partridge Path
- 25 Quail Hollow Rd
- 1226 Knowles Aly
- 1250 County Line Rd
- 1887 Green Valley Rd
- 2173 S Mcdonough Rd
- 1050 County Line Rd Unit 10.75AC
- 1693 S Mcdonough Rd
- 131 Townsend Ct
- 137 Townsend Ct
- 850 County Line Rd
- 529 Knollwood
- 2002 Millstream Ct
- 2000 Millstream Ct
- 1002 Farmington Rd Unit LOT 30
- 224 Autumn Ridge Dr
- 404 Woodcreek
- 139 Hunts Mill Cir
- 1011 Waverly Dr
- 1013 Waverly Dr
- 261 Hoppin Branch Rd
- 251 Hoppin Branch Rd
- 258 Hoppin Branch Rd
- 254 Hoppin Branch Rd
- 266 Hoppin Branch Rd
- 245 Hoppin Branch Rd
- 248 Hoppin Branch Rd
- 305 Hoppin Branch Rd
- 276 Hoppin Branch Rd
- 277 Hoppin Branch Rd
- 135 Quail Hollow Rd
- 309 Hoppin Branch Rd
- 242 Hoppin Branch Rd
- 313 Hoppin Branch Rd
- 130 Quail Hollow Rd
- 317 Hoppin Branch Rd
- 35 Partridge Path
- 60 Round Lake Rd
- 321 Hoppin Branch Rd Unit 4
- 321 Hoppin Branch Rd