
Seller's Agent in 2019
Claudia Da Silva
Coldwell Banker Realty - The Woodlands
(281) 916-4414
8 in this area
77 Total Sales

Estimated Value: $304,088 - $342,000
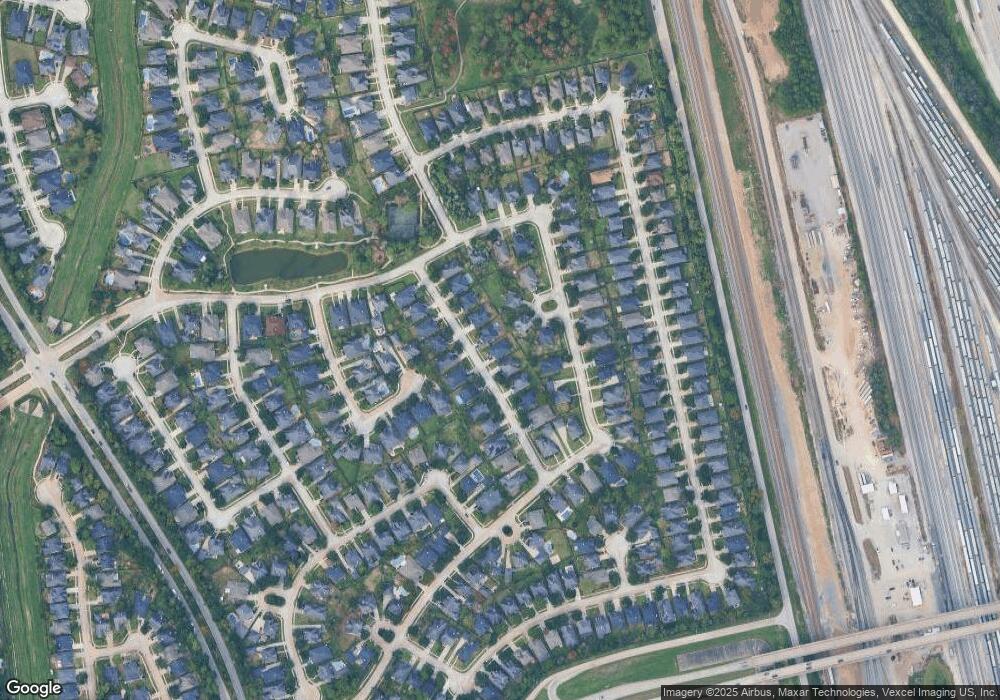
Beautiful DR Horton Home in the Gated Community of Spring Lakes. Subdivision never floods and high and dry during Harvey. Amenities include a tennis court, community pool, children playgrounds, picnic area, volleyball court and relaxing trails for walking and exercising around the peaceful lakes. This absolutely enchanting one story is in mint condition with new appliances, carpet, and ceiling fans. Impressive entrance with a supersized family room and fireplace, elegant formal dining, 3 bedrooms, a study that can be used a fourth bedroom or office/exercise room. Located off I-45, Grand Parkway, and Hardy Toll Road with close proximity to 1960 and Beltway 8. Minutes from indoor rock climbing, old town spring, splash town, restaurants, shopping, and The Woodlands. An easy access major employers: Exxon Campus, Anadarko. Don’t miss out on this one, schedule your private showing today!
Last Agent to Sell the Property
Coldwell Banker Realty - The Woodlands License #0672607 Listed on: 07/05/2019
Last Buyer's Agent
Shamusideen Balogun
eXp Realty LLC License #0646134
| Date | Buyer | Sale Price | Title Company |
|---|---|---|---|
| Bradford Sean Nicholas | -- | Momentum Title Llc | |
| Ingle Don M | -- | Great American Title | |
| Mittal Anuj | -- | Dhi Title |
| Date | Status | Borrower | Loan Amount |
|---|---|---|---|
| Open | Bradford Sean Nicholas | $215,000 | |
| Previous Owner | Ingle Don M | $120,000 | |
| Previous Owner | Mittal Anuj | $151,000 |
| Date | Event | Price | List to Sale | Price per Sq Ft |
|---|---|---|---|---|
| 08/18/2024 08/18/24 | Off Market | -- | -- | -- |
| 09/17/2019 09/17/19 | Sold | -- | -- | -- |
| 08/18/2019 08/18/19 | Pending | -- | -- | -- |
| 07/05/2019 07/05/19 | For Sale | $215,000 | -- | $100 / Sq Ft |
| Year | Tax Paid | Tax Assessment Tax Assessment Total Assessment is a certain percentage of the fair market value that is determined by local assessors to be the total taxable value of land and additions on the property. | Land | Improvement |
|---|---|---|---|---|
| 2025 | $5,726 | $324,852 | $57,670 | $267,182 |
| 2024 | $5,726 | $323,513 | $57,670 | $265,843 |
| 2023 | $5,726 | $339,316 | $57,670 | $281,646 |
| 2022 | $6,803 | $246,040 | $50,390 | $195,650 |
| 2021 | $6,487 | $236,396 | $50,390 | $186,006 |
| 2020 | $6,226 | $202,896 | $50,390 | $152,506 |
| 2019 | $5,780 | $182,624 | $50,390 | $132,234 |
| 2018 | $4,433 | $171,795 | $50,390 | $121,405 |
| 2017 | $5,733 | $180,700 | $50,390 | $130,310 |
| 2016 | $5,773 | $181,964 | $50,390 | $131,574 |
| 2015 | $5,067 | $181,964 | $50,390 | $131,574 |
| 2014 | $5,067 | $155,957 | $50,390 | $105,567 |
Seller's Agent in 2019
Claudia Da Silva
Coldwell Banker Realty - The Woodlands
(281) 916-4414
8 in this area
77 Total Sales
S
Buyer's Agent in 2019
Shamusideen Balogun
eXp Realty LLC
Source: Houston Association of REALTORS®
MLS Number: 4922648
APN: 1254070020002
Disclaimer: Certain information contained herein is derived from information provided by parties other than Homes.com. All information provided is deemed reliable, but is not guaranteed to be accurate and should be independently verified.
![]() Copyright 2026, Houston REALTORS® Information Service, Inc.
Copyright 2026, Houston REALTORS® Information Service, Inc.
The information provided is exclusively for consumers’ personal, non-commercial use, and may not be used for any purpose other than to identify prospective properties consumers may be interested in purchasing.
Information is deemed reliable but not guaranteed.
Ask me questions while you tour the home.