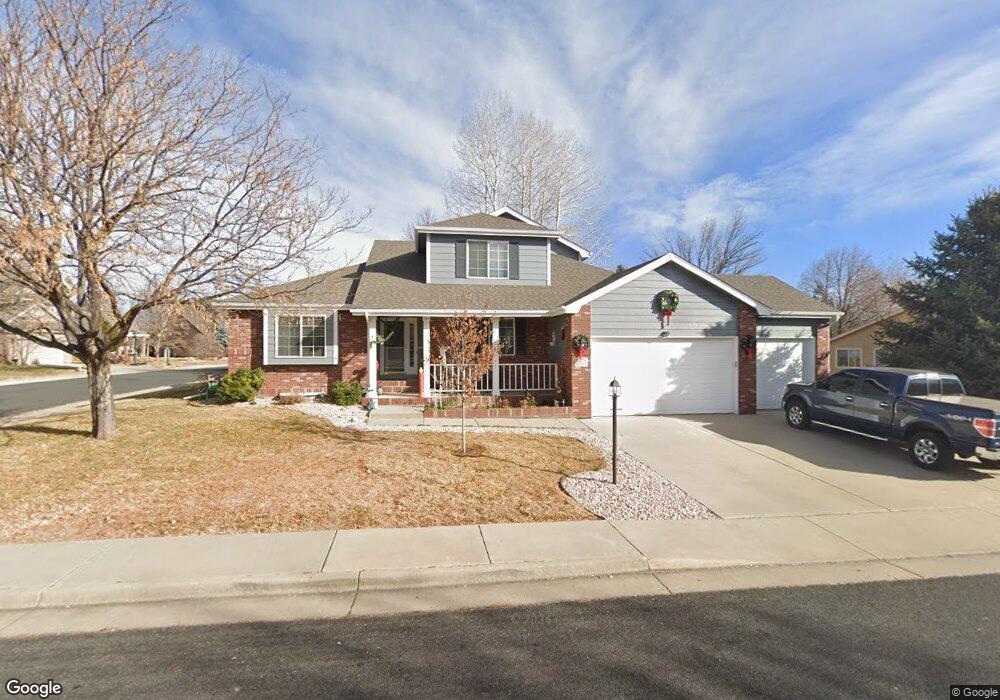
2571 Glendale Dr Loveland, CO 80538
Estimated Value: $536,505 - $627,000
3
Beds
3
Baths
1,838
Sq Ft
$323/Sq Ft
Est. Value
About This Home
This home is located at 2571 Glendale Dr, Loveland, CO 80538 and is currently estimated at $593,876, approximately $323 per square foot. 2571 Glendale Dr is a home located in Larimer County with nearby schools including Centennial Elementary School, Lucile Erwin Middle School, and Loveland High School.
Ownership History
Date
Name
Owned For
Owner Type
Purchase Details
Closed on
Oct 22, 2021
Sold by
Steine Deane R
Bought by
Mathiesen David R and Mathiesen Peggy L
Current Estimated Value
Home Financials for this Owner
Home Financials are based on the most recent Mortgage that was taken out on this home.
Original Mortgage
$928,613
Outstanding Balance
$846,808
Interest Rate
2.8%
Mortgage Type
Future Advance Clause Open End Mortgage
Estimated Equity
-$252,932
Purchase Details
Closed on
Nov 9, 2000
Sold by
Steine Deane R Charmie L
Bought by
Steine Deane R and Steine Charmie L
Purchase Details
Closed on
Aug 6, 1998
Sold by
C W Springfield Co
Bought by
Steine Deane R and Steine Charmie L
Purchase Details
Closed on
Jan 30, 1998
Sold by
Glen Properties Inc
Bought by
C W Springfield Co
Purchase Details
Closed on
Apr 1, 1996
Sold by
Emerald Glen Loveland Community Assn
Bought by
Glen Properties Inc
Create a Home Valuation Report for This Property
The Home Valuation Report is an in-depth analysis detailing your home's value as well as a comparison with similar homes in the area
Home Values in the Area
Average Home Value in this Area
Purchase History
| Date | Buyer | Sale Price | Title Company |
|---|---|---|---|
| Mathiesen David R | $509,000 | Land Title Guarantee | |
| Steine Deane R | -- | -- | |
| Steine Deane R | $207,973 | -- | |
| C W Springfield Co | $107,500 | -- | |
| Glen Properties Inc | -- | -- |
Source: Public Records
Mortgage History
| Date | Status | Borrower | Loan Amount |
|---|---|---|---|
| Open | Mathiesen David R | $928,613 |
Source: Public Records
Tax History Compared to Growth
Tax History
| Year | Tax Paid | Tax Assessment Tax Assessment Total Assessment is a certain percentage of the fair market value that is determined by local assessors to be the total taxable value of land and additions on the property. | Land | Improvement |
|---|---|---|---|---|
| 2025 | $2,682 | $37,292 | $3,330 | $33,962 |
| 2024 | $2,587 | $37,292 | $3,330 | $33,962 |
| 2022 | $2,200 | $27,647 | $3,454 | $24,193 |
| 2021 | $1,692 | $28,443 | $3,554 | $24,889 |
| 2020 | $1,599 | $27,263 | $3,554 | $23,709 |
| 2019 | $1,572 | $27,263 | $3,554 | $23,709 |
| 2018 | $1,439 | $24,688 | $3,578 | $21,110 |
| 2017 | $1,239 | $24,688 | $3,578 | $21,110 |
| 2016 | $1,133 | $23,402 | $3,956 | $19,446 |
| 2015 | $1,123 | $23,410 | $3,960 | $19,450 |
| 2014 | $929 | $20,310 | $3,960 | $16,350 |
Source: Public Records
Map
Nearby Homes
- 2554 W 44th St
- 2465 Glen Isle Dr
- 2643 W 45th St
- 2250 W 44th St
- 2684 W 46th St
- 2597 W 46th St
- 4559 Keota Place
- 3890 Kremmling Dr
- 3902 Penrose Ave
- 2070 Tonopas Ct
- 3007 Benfold St
- 4106 Cripple Creek Dr
- 2960 Kincaid Dr Unit 303
- 4719 Degas Dr
- 2920 Donatello St
- 4725 Degas Dr
- 4733 Degas Dr
- 2617 W 36th St
- 2958 Donatello St
- 4745 Degas Dr
- 2520 Glendale Ct
- 2543 Glendale Dr
- 2547 Glendale Ct
- 2564 Glendale Dr
- 2578 Glendale Dr
- 2502 Glendale Ct
- 2550 Glendale Dr
- 2529 Glendale Ct
- 2515 Glendale Dr
- 2592 Glendale Dr
- 2511 Glendale Ct
- 2599 Glendale Dr
- 2484 Glendale Ct
- 2536 Glendale Dr
- 2501 Glendale Dr
- 2493 Glendale Ct
- 2606 Glendale Dr
- 4148 Glen Isle Ct
- 4172 Glen Isle Ct
- 2607 Glendale Dr