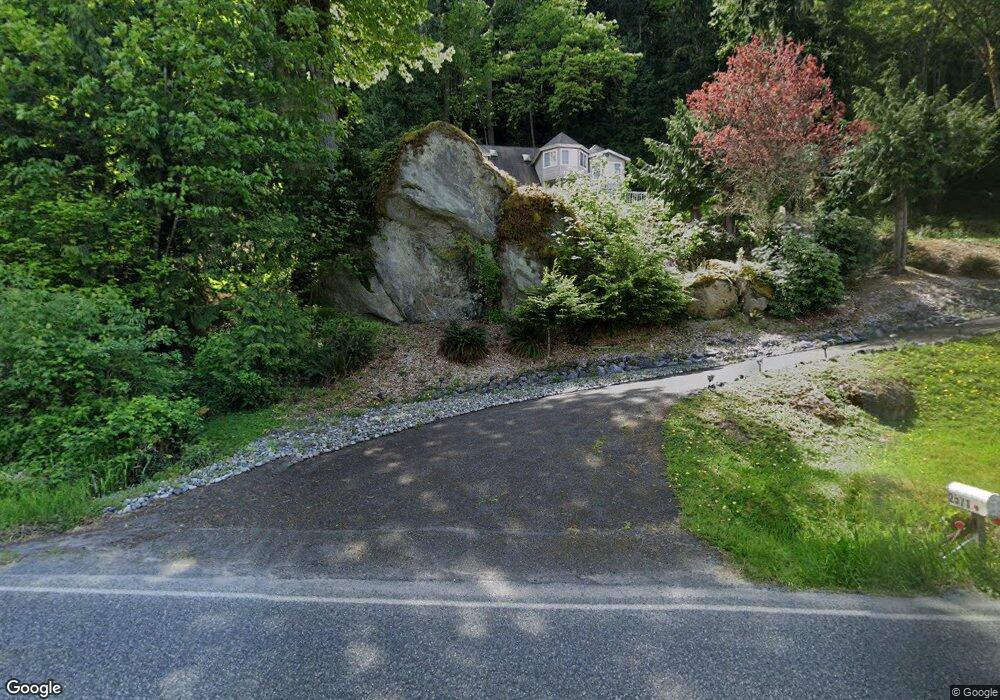
2571 Lake Whatcom Blvd Bellingham, WA 98229
Estimated Value: $1,193,721 - $1,390,000
3
Beds
3
Baths
3,244
Sq Ft
$398/Sq Ft
Est. Value
About This Home
This home is located at 2571 Lake Whatcom Blvd, Bellingham, WA 98229 and is currently estimated at $1,292,180, approximately $398 per square foot. 2571 Lake Whatcom Blvd is a home located in Whatcom County with nearby schools including Geneva Elementary School, Kulshan Middle School, and Bellingham High School.
Ownership History
Date
Name
Owned For
Owner Type
Purchase Details
Closed on
May 9, 2012
Sold by
Vanvannguyen Trinh Van and Le Loi Thi
Bought by
Vanvannguyen Trinh Van and Le Loi Thi
Current Estimated Value
Purchase Details
Closed on
Jul 7, 2005
Sold by
Newbold James Wayne and Newbold Patricia Jean
Bought by
Vannguyen Trinh and Le Loi T
Home Financials for this Owner
Home Financials are based on the most recent Mortgage that was taken out on this home.
Original Mortgage
$350,000
Outstanding Balance
$181,759
Interest Rate
5.58%
Mortgage Type
Fannie Mae Freddie Mac
Estimated Equity
$1,110,421
Purchase Details
Closed on
Jul 7, 2004
Sold by
Kantor Edmund M and Kantor Karen E
Bought by
Newbold James Wayne and Newbold Patricia Jean
Create a Home Valuation Report for This Property
The Home Valuation Report is an in-depth analysis detailing your home's value as well as a comparison with similar homes in the area
Home Values in the Area
Average Home Value in this Area
Purchase History
| Date | Buyer | Sale Price | Title Company |
|---|---|---|---|
| Vanvannguyen Trinh Van | -- | None Available | |
| Vannguyen Trinh | $550,280 | Whatcom Land Title | |
| Newbold James Wayne | $369,000 | Whatcom Land Title |
Source: Public Records
Mortgage History
| Date | Status | Borrower | Loan Amount |
|---|---|---|---|
| Open | Vannguyen Trinh | $350,000 |
Source: Public Records
Tax History Compared to Growth
Tax History
| Year | Tax Paid | Tax Assessment Tax Assessment Total Assessment is a certain percentage of the fair market value that is determined by local assessors to be the total taxable value of land and additions on the property. | Land | Improvement |
|---|---|---|---|---|
| 2024 | $10,269 | $1,158,916 | $459,315 | $699,601 |
| 2023 | $10,269 | $1,188,360 | $470,985 | $717,375 |
| 2022 | $8,191 | $861,112 | $341,286 | $519,826 |
| 2021 | $7,090 | $748,793 | $296,770 | $452,023 |
| 2020 | $7,267 | $634,570 | $251,500 | $383,070 |
| 2019 | $6,584 | $644,833 | $256,576 | $388,257 |
| 2018 | $6,785 | $598,309 | $238,064 | $360,245 |
| 2017 | $6,163 | $525,265 | $209,000 | $316,265 |
| 2016 | $5,725 | $497,350 | $197,893 | $299,457 |
| 2015 | $5,674 | $483,858 | $192,525 | $291,333 |
| 2014 | -- | $465,248 | $185,120 | $280,128 |
| 2013 | -- | $438,612 | $160,200 | $278,412 |
Source: Public Records
Map
Nearby Homes
- 2550 Lake Whatcom Blvd
- 209 Harbor View Dr
- 196 Sudden Valley Dr
- 203 Sudden Valley Dr
- 39 Stable Ln
- 13 Westbrook Ct
- 2678 Strawberry Shore Dr
- 22 Jasper Ridge Ln
- 24 Jasper Ridge Ln
- 142 Polo Park Dr
- 137 Sudden Valley Dr
- 11 Granite Cir
- 30 Lost Lake Ln
- 7 Lost Lake Ln Unit A
- 34 Green Hill Rd
- 20 Hillside Place
- 14 Black Bear Ct Unit A
- 8 Huckleberry Ct
- 3 Huckleberry Ct Unit B
- 2593 Northshore Rd
- 2568 Lake Whatcom Blvd
- 2572 Lake Whatcom Blvd
- 2563 Lake Whatcom Blvd
- 2566 Lake Whatcom Blvd
- 2574 Lake Whatcom Blvd
- 2576 Lake Whatcom Blvd
- 2560 Lake Whatcom Blvd
- 2580 Lake Whatcom Blvd
- 2582 Lake Whatcom Blvd
- 2586 Lake Whatcom Blvd
- 2556 Lake Whatcom Blvd
- 2588 Lake Whatcom Blvd
- 2591 Lake Whatcom Blvd
- 2592 Lake Whatcom Blvd
- 2594 Lake Whatcom Blvd
- 2597 Lake Whatcom Blvd
- 2598 Lake Whatcom Blvd
- 2546 Lake Whatcom Blvd
- 2542 Lake Whatcom Blvd
- 2538 Lake Whatcom Blvd