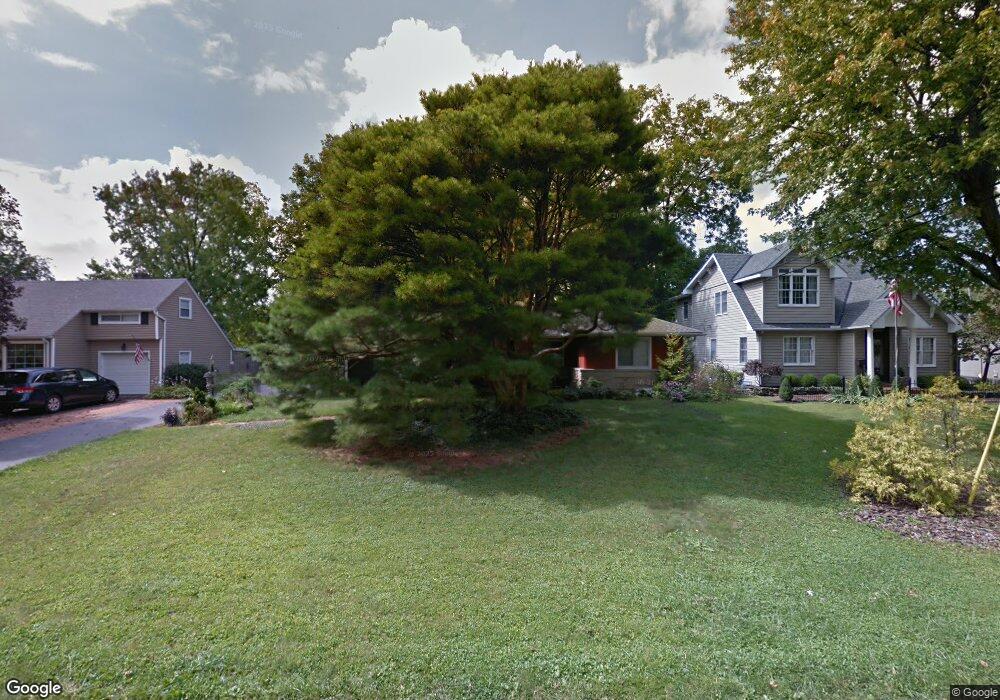
2571 Mount Holyoke Rd Columbus, OH 43221
Estimated Value: $347,000 - $404,000
2
Beds
1
Bath
954
Sq Ft
$394/Sq Ft
Est. Value
About This Home
This home is located at 2571 Mount Holyoke Rd, Columbus, OH 43221 and is currently estimated at $375,706, approximately $393 per square foot. 2571 Mount Holyoke Rd is a home located in Franklin County with nearby schools including Tremont Elementary School, Jones Middle School, and Upper Arlington High School.
Ownership History
Date
Name
Owned For
Owner Type
Purchase Details
Closed on
Mar 18, 2011
Sold by
Day Mark T and Day Nancy E
Bought by
Shanghi Enterprises Llc
Current Estimated Value
Home Financials for this Owner
Home Financials are based on the most recent Mortgage that was taken out on this home.
Original Mortgage
$140,000
Interest Rate
4.88%
Mortgage Type
Future Advance Clause Open End Mortgage
Purchase Details
Closed on
Apr 20, 1998
Sold by
Herraiz Domingo S
Bought by
Deleo Joyce Carolyn
Purchase Details
Closed on
Jan 2, 1991
Purchase Details
Closed on
Apr 5, 1990
Create a Home Valuation Report for This Property
The Home Valuation Report is an in-depth analysis detailing your home's value as well as a comparison with similar homes in the area
Home Values in the Area
Average Home Value in this Area
Purchase History
| Date | Buyer | Sale Price | Title Company |
|---|---|---|---|
| Shanghi Enterprises Llc | $350,000 | Attorney | |
| Deleo Joyce Carolyn | $115,000 | Chicago Title West | |
| -- | $77,300 | -- | |
| -- | -- | -- |
Source: Public Records
Mortgage History
| Date | Status | Borrower | Loan Amount |
|---|---|---|---|
| Closed | Shanghi Enterprises Llc | $140,000 |
Source: Public Records
Tax History Compared to Growth
Tax History
| Year | Tax Paid | Tax Assessment Tax Assessment Total Assessment is a certain percentage of the fair market value that is determined by local assessors to be the total taxable value of land and additions on the property. | Land | Improvement |
|---|---|---|---|---|
| 2024 | $7,161 | $123,690 | $75,950 | $47,740 |
| 2023 | $7,072 | $123,690 | $75,950 | $47,740 |
| 2022 | $6,350 | $90,870 | $53,590 | $37,280 |
| 2021 | $5,621 | $90,870 | $53,590 | $37,280 |
| 2020 | $5,571 | $90,870 | $53,590 | $37,280 |
| 2019 | $5,704 | $82,260 | $53,590 | $28,670 |
| 2018 | $5,050 | $82,260 | $53,590 | $28,670 |
| 2017 | $5,121 | $87,680 | $59,540 | $28,140 |
| 2016 | $4,432 | $67,030 | $34,790 | $32,240 |
| 2015 | $4,428 | $67,030 | $34,790 | $32,240 |
| 2014 | $4,433 | $67,030 | $34,790 | $32,240 |
| 2013 | $2,117 | $60,935 | $31,640 | $29,295 |
Source: Public Records
Map
Nearby Homes
- 2648 Chester Rd
- 2569 Chester Rd
- 2615 Northwest Blvd
- 1565 Berkshire Rd
- 1535 Doone Rd
- 1481 Doone Rd
- 1980 W Lane Ave
- 3015 Welsford Rd
- 2110 Northwest Blvd
- 1909 Inchcliff Rd
- 2063 Westover Rd
- 2027-2033 Ridgeview Rd
- 1111 Sunny Hill Dr
- 1887-1891 Kentwell Rd
- 3156 Mt Holyoke Rd
- 3106 Somerford Rd
- 1098 Stanhope Dr
- 965 Manor Ln Unit W
- 1398 Lower Green Cir Unit 1398
- 1837 Elmwood Ave
- 2579 Mount Holyoke Rd
- 2561 Mount Holyoke Rd
- 2587 Mount Holyoke Rd
- 2553 Mount Holyoke Rd
- 1608 College Hill Dr
- 2570 Mount Holyoke Rd
- 2570 Mt Holyoke Rd
- 2568 Westmont Blvd
- 2576 Westmont Blvd
- 2560 Westmont Blvd
- 2595 Mount Holyoke Rd
- 2584 Westmont Blvd
- 2543 Mount Holyoke Rd
- 2552 Westmont Blvd
- 1600 College Hill Dr
- 2590 Mount Holyoke Rd
- 2592 Westmont Blvd
- 2544 Westmont Blvd
- 1609 College Hill Dr
- 2601 Mount Holyoke Rd