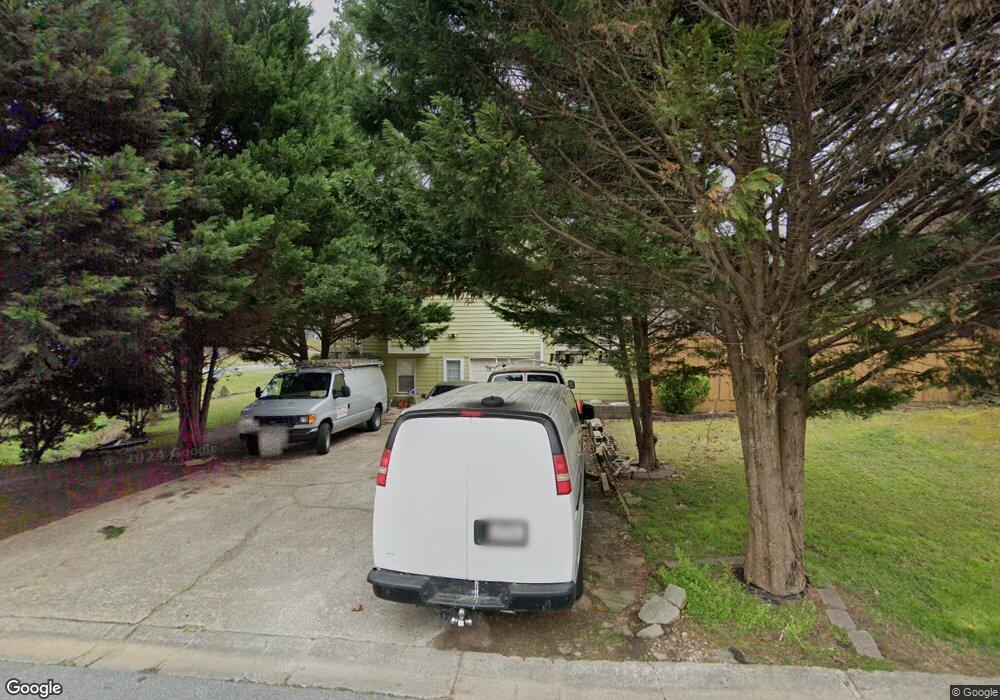
2571 Smith Ave SW Unit 6 Marietta, GA 30064
Estimated Value: $367,000 - $399,000
3
Beds
2
Baths
2,010
Sq Ft
$188/Sq Ft
Est. Value
About This Home
This home is located at 2571 Smith Ave SW Unit 6, Marietta, GA 30064 and is currently estimated at $377,814, approximately $187 per square foot. 2571 Smith Ave SW Unit 6 is a home located in Cobb County with nearby schools including Hollydale Elementary School, Smitha Middle School, and Osborne High School.
Ownership History
Date
Name
Owned For
Owner Type
Purchase Details
Closed on
Apr 26, 2001
Sold by
Steffen Eduardo
Bought by
Canales Jose I
Current Estimated Value
Home Financials for this Owner
Home Financials are based on the most recent Mortgage that was taken out on this home.
Original Mortgage
$141,775
Outstanding Balance
$52,108
Interest Rate
6.98%
Mortgage Type
New Conventional
Estimated Equity
$325,706
Purchase Details
Closed on
Oct 6, 2000
Sold by
Sec Of Hud
Bought by
Steffen Eduardo
Home Financials for this Owner
Home Financials are based on the most recent Mortgage that was taken out on this home.
Original Mortgage
$116,043
Interest Rate
7.82%
Mortgage Type
FHA
Purchase Details
Closed on
Aug 4, 1999
Sold by
Davis Leonora W
Bought by
Heard Samantha D
Home Financials for this Owner
Home Financials are based on the most recent Mortgage that was taken out on this home.
Original Mortgage
$143,661
Interest Rate
7.58%
Mortgage Type
FHA
Purchase Details
Closed on
Oct 23, 1996
Sold by
Shattah Rachel Ann
Bought by
Davis Leonora W
Create a Home Valuation Report for This Property
The Home Valuation Report is an in-depth analysis detailing your home's value as well as a comparison with similar homes in the area
Home Values in the Area
Average Home Value in this Area
Purchase History
| Date | Buyer | Sale Price | Title Company |
|---|---|---|---|
| Canales Jose I | $144,000 | -- | |
| Steffen Eduardo | -- | -- | |
| Heard Samantha D | $144,900 | -- | |
| Davis Leonora W | $111,500 | -- |
Source: Public Records
Mortgage History
| Date | Status | Borrower | Loan Amount |
|---|---|---|---|
| Open | Canales Jose I | $141,775 | |
| Previous Owner | Steffen Eduardo | $116,043 | |
| Previous Owner | Heard Samantha D | $143,661 | |
| Closed | Davis Leonora W | $0 |
Source: Public Records
Tax History Compared to Growth
Tax History
| Year | Tax Paid | Tax Assessment Tax Assessment Total Assessment is a certain percentage of the fair market value that is determined by local assessors to be the total taxable value of land and additions on the property. | Land | Improvement |
|---|---|---|---|---|
| 2025 | $4,328 | $143,656 | $22,800 | $120,856 |
| 2024 | $4,331 | $143,656 | $22,800 | $120,856 |
| 2023 | $4,331 | $143,656 | $22,800 | $120,856 |
| 2022 | $3,090 | $101,804 | $22,800 | $79,004 |
| 2021 | $2,684 | $88,428 | $14,000 | $74,428 |
| 2020 | $2,363 | $77,868 | $14,000 | $63,868 |
| 2019 | $2,363 | $77,868 | $14,000 | $63,868 |
| 2018 | $1,852 | $61,016 | $8,000 | $53,016 |
| 2017 | $1,754 | $61,016 | $8,000 | $53,016 |
| 2016 | $1,393 | $48,444 | $8,000 | $40,444 |
| 2015 | $1,427 | $48,444 | $8,000 | $40,444 |
| 2014 | $906 | $30,488 | $0 | $0 |
Source: Public Records
Map
Nearby Homes
- 2554 Red Barn Rd SW
- 2608 Foxwood Place SW Unit IV
- 2450 Horseshoe Bend Rd SW
- 2625 Deerfield Cir SW
- 2448 Wood Meadows Dr SW
- 2599 Candler Way SW
- 2730 Hembree Rd SW
- 2720 Cold Springs Trail SW
- 2490 Wood Meadows Dr SW
- 2723 Horseshoe Creek Dr SW
- 2318 Powder Springs Rd SW
- 2415 Bankstone Dr SW
- 3106 Yellowhammer Dr Unit 28
- 3118 Yellowhammer Dr Unit 25
- 3047 Patriot Square SW
- 2885 Mondavi Place
- 3614 Josh Ct
- 3089 Yellowhammer Dr
- 2577 Smith Ave SW Unit 6
- 2760 Rock Creek Dr SW Unit 3
- 2770 Rock Creek Dr SW
- 2578 Smith Ave SW
- 2581 Owens Ave SW Unit 4
- 2546 Red Barn Rd SW
- 2585 Smith Ave SW
- 2580 Owens Ave SW
- 0 Owens Ave Unit 3235368
- 0 Owens Ave Unit 8883403
- 0 Owens Ave Unit 7569368
- 0 Owens Ave
- 2780 Rock Creek Dr SW
- 2559 Smith Ave SW Unit 4
- 2526 Red Barn Rd SW
- 2526 Red Barn Rd SW Unit 2526
- 2560 Smith Ave SW
- 2588 Smith Ave SW
- 2765 Rock Creek Dr SW
- 2587 Owens Ave SW