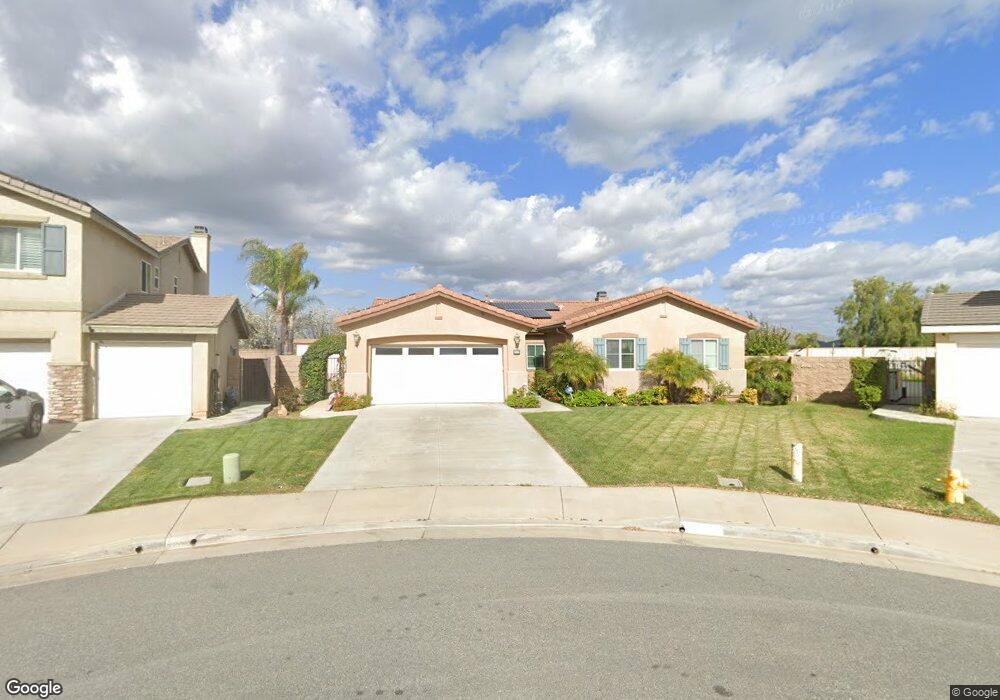
25710 Mesa Edge Ct Sun City, CA 92585
Estimated Value: $539,000 - $591,620
4
Beds
2
Baths
1,886
Sq Ft
$298/Sq Ft
Est. Value
About This Home
This home is located at 25710 Mesa Edge Ct, Sun City, CA 92585 and is currently estimated at $561,405, approximately $297 per square foot. 25710 Mesa Edge Ct is a home located in Riverside County with nearby schools including Ridgemoor Elementary School, Hans Christensen Middle School, and Pinacate Middle School.
Ownership History
Date
Name
Owned For
Owner Type
Purchase Details
Closed on
Jan 19, 2010
Sold by
Disanza Carmella
Bought by
Disanza Carmella Anne and Carmella Anne Disanza Living Trust
Current Estimated Value
Purchase Details
Closed on
Jun 23, 2008
Sold by
Gmac Mortgage Llc
Bought by
Disanza Carmella
Purchase Details
Closed on
Feb 13, 2008
Sold by
Robinson Mark A and Robinson Nanci Rene
Bought by
Gmac Mortgage Llc and Gmac Mortgage Corp
Purchase Details
Closed on
Oct 10, 2005
Sold by
Lennar Homes Of California Inc
Bought by
Robinson Mark A and Robinson Nanci Rene
Home Financials for this Owner
Home Financials are based on the most recent Mortgage that was taken out on this home.
Original Mortgage
$310,535
Interest Rate
5.93%
Mortgage Type
Fannie Mae Freddie Mac
Create a Home Valuation Report for This Property
The Home Valuation Report is an in-depth analysis detailing your home's value as well as a comparison with similar homes in the area
Home Values in the Area
Average Home Value in this Area
Purchase History
| Date | Buyer | Sale Price | Title Company |
|---|---|---|---|
| Disanza Carmella Anne | -- | None Available | |
| Disanza Carmella | $215,000 | First American Title Company | |
| Gmac Mortgage Llc | $274,500 | None Available | |
| Robinson Mark A | $388,500 | North American Title Company |
Source: Public Records
Mortgage History
| Date | Status | Borrower | Loan Amount |
|---|---|---|---|
| Previous Owner | Robinson Mark A | $310,535 |
Source: Public Records
Tax History Compared to Growth
Tax History
| Year | Tax Paid | Tax Assessment Tax Assessment Total Assessment is a certain percentage of the fair market value that is determined by local assessors to be the total taxable value of land and additions on the property. | Land | Improvement |
|---|---|---|---|---|
| 2025 | $4,890 | $276,847 | $103,010 | $173,837 |
| 2023 | $4,890 | $266,099 | $99,011 | $167,088 |
| 2022 | $4,863 | $260,882 | $97,070 | $163,812 |
| 2021 | $4,779 | $255,767 | $95,167 | $160,600 |
| 2020 | $4,726 | $253,146 | $94,192 | $158,954 |
| 2019 | $4,641 | $248,184 | $92,346 | $155,838 |
| 2018 | $4,514 | $243,319 | $90,536 | $152,783 |
| 2017 | $4,438 | $238,549 | $88,761 | $149,788 |
| 2016 | $4,329 | $233,872 | $87,021 | $146,851 |
| 2015 | $4,284 | $230,362 | $85,715 | $144,647 |
| 2014 | $4,351 | $225,851 | $84,037 | $141,814 |
Source: Public Records
Map
Nearby Homes
- 25700 Cedar River Ct
- 25672 Hillman Ct
- 26787 Calle Emiliano
- 25683 Hillman Ct
- 27042 Rangewood St
- 27321 Prominence Rd
- 27083 Stagewood St
- Pathmaker Plan at Cimarron Ridge - Pathway
- Gateway Plan at Cimarron Ridge - Pathway
- Visionary Plan at Cimarron Ridge - Pathway
- 27155 Stagewood St
- 26063 Bluebell St
- 26629 Calle Gregorio
- 25367 Circlestone Dr
- 25338 Violane Dr
- Ferndale Plan at Cimarron Ridge - Greenway
- Gateway Plan at Cimarron Ridge - Greenway
- Pinewood Plan at Cimarron Ridge - Greenway
- 27250 Murrieta Rd Unit 84
- 27250 Murrieta Rd Unit 189
- 25698 Mesa Edge Ct
- 25713 Mesa Edge Ct
- 27037 Geary St
- 27025 Geary St
- 27049 Geary St
- 25686 Mesa Edge Ct
- 25701 Mesa Edge Ct
- 27061 Geary St
- 25689 Mesa Edge Ct
- 25674 Mesa Edge Ct
- 27073 Geary St
- 25677 Mesa Edge Ct
- 25720 Turfwood St
- 25708 Turfwood St
- 25662 Mesa Edge Ct
- 25696 Turfwood St
- 25684 Turfwood St
- 25665 Mesa Edge Ct
- 27085 Geary St
- 27039 Comet View Ct