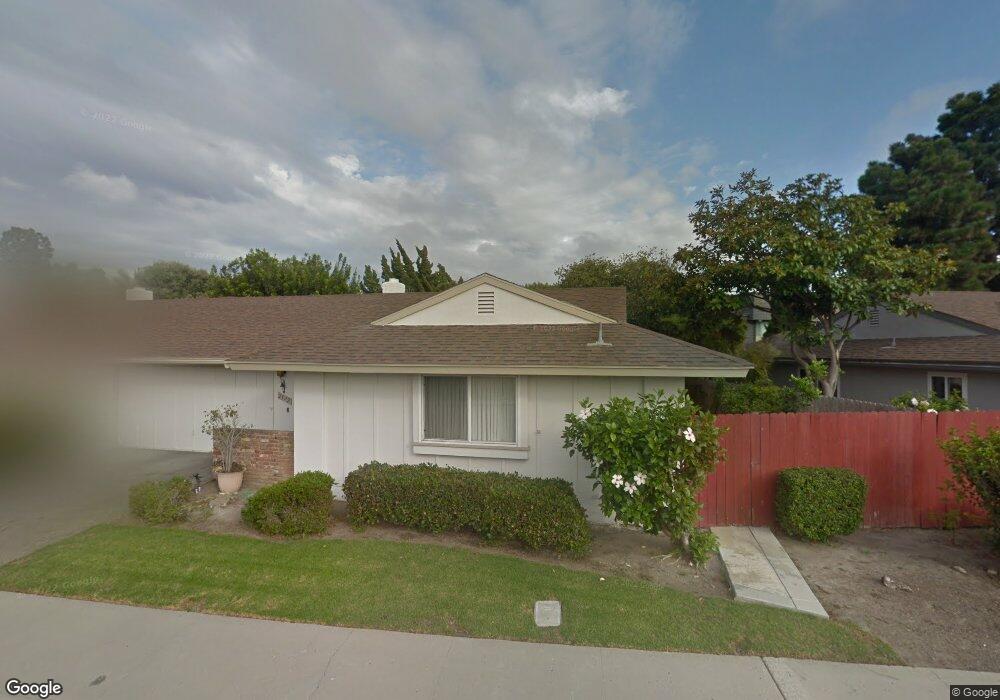
2572 Neptune Place Port Hueneme, CA 93041
Estimated Value: $521,000 - $612,430
3
Beds
3
Baths
1,481
Sq Ft
$391/Sq Ft
Est. Value
About This Home
This home is located at 2572 Neptune Place, Port Hueneme, CA 93041 and is currently estimated at $578,358, approximately $390 per square foot. 2572 Neptune Place is a home located in Ventura County with nearby schools including Marina West Elementary School, Oxnard High School, and St. Anthony's Elementary School.
Ownership History
Date
Name
Owned For
Owner Type
Purchase Details
Closed on
Jun 26, 2025
Sold by
Spurling Karen Lee
Bought by
Spurling John Robert
Current Estimated Value
Purchase Details
Closed on
Jun 20, 2025
Sold by
Christensen Nancy Lyn
Bought by
Spurling John Robert
Purchase Details
Closed on
Jun 17, 2025
Sold by
Spurling John Robert
Bought by
Spurling John Robert and Spurling Rebecca Ann
Purchase Details
Closed on
Mar 23, 2007
Sold by
Roberts Jane C
Bought by
Roberts Jane Carolyn
Purchase Details
Closed on
Feb 22, 2006
Sold by
Spurling Sally Ann
Bought by
Roberts Jane C
Purchase Details
Closed on
Feb 21, 2006
Sold by
Roberts Jane C
Bought by
Roberts Jane C and Spurling Sally Ann
Create a Home Valuation Report for This Property
The Home Valuation Report is an in-depth analysis detailing your home's value as well as a comparison with similar homes in the area
Home Values in the Area
Average Home Value in this Area
Purchase History
| Date | Buyer | Sale Price | Title Company |
|---|---|---|---|
| Spurling John Robert | -- | None Listed On Document | |
| Spurling John Robert | -- | None Listed On Document | |
| Spurling John Robert | -- | None Listed On Document | |
| Spurling John Robert | -- | None Listed On Document | |
| Roberts Jane Carolyn | -- | None Available | |
| Roberts Jane C | $185,000 | None Available | |
| Roberts Jane C | -- | None Available |
Source: Public Records
Tax History Compared to Growth
Tax History
| Year | Tax Paid | Tax Assessment Tax Assessment Total Assessment is a certain percentage of the fair market value that is determined by local assessors to be the total taxable value of land and additions on the property. | Land | Improvement |
|---|---|---|---|---|
| 2025 | $3,414 | $286,936 | $177,795 | $109,141 |
| 2024 | $3,414 | $281,310 | $174,309 | $107,001 |
| 2023 | $3,322 | $275,795 | $170,892 | $104,903 |
| 2022 | $3,198 | $270,388 | $167,541 | $102,847 |
| 2021 | $3,131 | $265,087 | $164,256 | $100,831 |
| 2020 | $3,095 | $262,372 | $162,573 | $99,799 |
| 2019 | $3,057 | $257,229 | $159,386 | $97,843 |
| 2018 | $3,026 | $252,186 | $156,261 | $95,925 |
| 2017 | $2,860 | $247,243 | $153,198 | $94,045 |
| 2016 | $2,811 | $242,396 | $150,195 | $92,201 |
| 2015 | $2,730 | $238,757 | $147,940 | $90,817 |
| 2014 | $2,721 | $234,082 | $145,043 | $89,039 |
Source: Public Records
Map
Nearby Homes
- 130 E Bay Blvd
- 163 E Bowling Green
- 306 E Elfin Green
- 337 E Elfin Green
- 271 E Fiesta Green
- 117 W Channel Islands Blvd
- 317 E Garden Green
- 162 W Alta Green
- 169 W Alta Green
- 151 W Bay Blvd
- 66 W Garden Green
- 82 W Garden Green
- 2464 Manzanita Dr
- 225 W Channel Islands Blvd
- 2466 Bolker Dr
- 2456 Bolker Dr
- 2732 Bolker Dr
- 2754 Bolker Dr
- 3100 Napa St
- 426 Reed Way
- 2574 Neptune Place
- 2570 Neptune Place
- 2568 Neptune Place
- 2576 Neptune Place
- 2559 Neptune Place
- 2561 Neptune Place
- 2557 Neptune Place
- 2563 Neptune Place
- 2578 Neptune Place
- 2555 Neptune Place
- 2566 Neptune Place
- 2570 Ukiah St
- 2565 Neptune Place
- 2577 Neptune Place
- 2566 Ukiah St
- 2553 Neptune Place
- 2580 Neptune Place
- 2564 Neptune Place
- 2572 Ukiah St
- 2529 Neptune Place