25720 Dahle Ave Faribault, MN 55021
Estimated Value: $538,000 - $656,000
3
Beds
3
Baths
1,295
Sq Ft
$456/Sq Ft
Est. Value
About This Home
This home is located at 25720 Dahle Ave, Faribault, MN 55021 and is currently estimated at $590,314, approximately $455 per square foot. 25720 Dahle Ave is a home located in Rice County with nearby schools including Medford Elementary School and Medford Secondary School.
Ownership History
Date
Name
Owned For
Owner Type
Purchase Details
Closed on
Jun 22, 2020
Sold by
Nyman Bruce T and Nyman Teri Ss
Bought by
Shetka Richard Joseph and Shetka Crystal Elizabeth
Current Estimated Value
Home Financials for this Owner
Home Financials are based on the most recent Mortgage that was taken out on this home.
Original Mortgage
$418,000
Outstanding Balance
$363,975
Interest Rate
3.1%
Mortgage Type
New Conventional
Estimated Equity
$226,339
Purchase Details
Closed on
Jan 31, 2020
Sold by
Caltholic Chr Of Divine Mercy Of Faribau
Bought by
Nymann Bruce and Nymann Teri
Purchase Details
Closed on
Sep 27, 2002
Sold by
Grinnell Rodney P and Grinnell Jodi A
Bought by
Nymann Bruce T and Nymann Teri S
Purchase Details
Closed on
Sep 8, 2000
Sold by
Grinnell Rodney P and Grinnell Jodi A
Bought by
Roehrick Kelly M and Roehrick Shan M
Create a Home Valuation Report for This Property
The Home Valuation Report is an in-depth analysis detailing your home's value as well as a comparison with similar homes in the area
Purchase History
We collect this data history from publicly available records. To have your information removed, we recommend requesting removal directly through your county’s website.
| Date | Buyer | Sale Price | Title Company |
|---|---|---|---|
| Shetka Richard Joseph | $440,000 | At Title Llc | |
| Shetka Richard Joseph | $440,000 | At Title Llc | |
| Nymann Bruce | $31,500 | Knight Barry Ttl United Llc | |
| Nymann Bruce | $31,500 | Knight Barry Ttl United Llc | |
| Nymann Bruce T | $105,000 | -- | |
| Nymann Bruce T | $105,000 | -- | |
| Roehrick Kelly M | $20,000 | -- | |
| Roehrick Kelly M | $30,000 | -- | |
| Roehrick Kelly M | $20,000 | -- | |
| Roehrick Kelly M | $30,000 | -- |
Source: Public Records
Mortgage History
We collect this data history from publicly available records. To have your information removed, we recommend requesting removal directly through your county’s website.
| Date | Status | Borrower | Loan Amount |
|---|---|---|---|
| Open | Shetka Richard Joseph | $418,000 |
Source: Public Records
Tax History
| Year | Tax Paid | Tax Assessment Tax Assessment Total Assessment is a certain percentage of the fair market value that is determined by local assessors to be the total taxable value of land and additions on the property. | Land | Improvement |
|---|---|---|---|---|
| 2026 | $4,428 | $571,800 | $179,900 | $391,900 |
| 2025 | $4,428 | $554,100 | $165,000 | $389,100 |
| 2024 | $4,450 | $516,600 | $147,500 | $369,100 |
| 2023 | $4,260 | $516,600 | $147,500 | $369,100 |
| 2022 | $4,164 | $484,500 | $130,000 | $354,500 |
| 2021 | $3,792 | $441,900 | $116,500 | $325,400 |
| 2020 | $3,536 | $395,200 | $114,000 | $281,200 |
| 2019 | $3,430 | $365,900 | $114,000 | $251,900 |
| 2018 | $3,108 | $353,700 | $114,000 | $239,700 |
| 2017 | $3,108 | $318,100 | $98,400 | $219,700 |
| 2016 | $3,210 | $316,300 | $98,400 | $217,900 |
| 2015 | $3,120 | $314,500 | $98,400 | $216,100 |
| 2014 | -- | $316,900 | $98,400 | $218,500 |
Source: Public Records
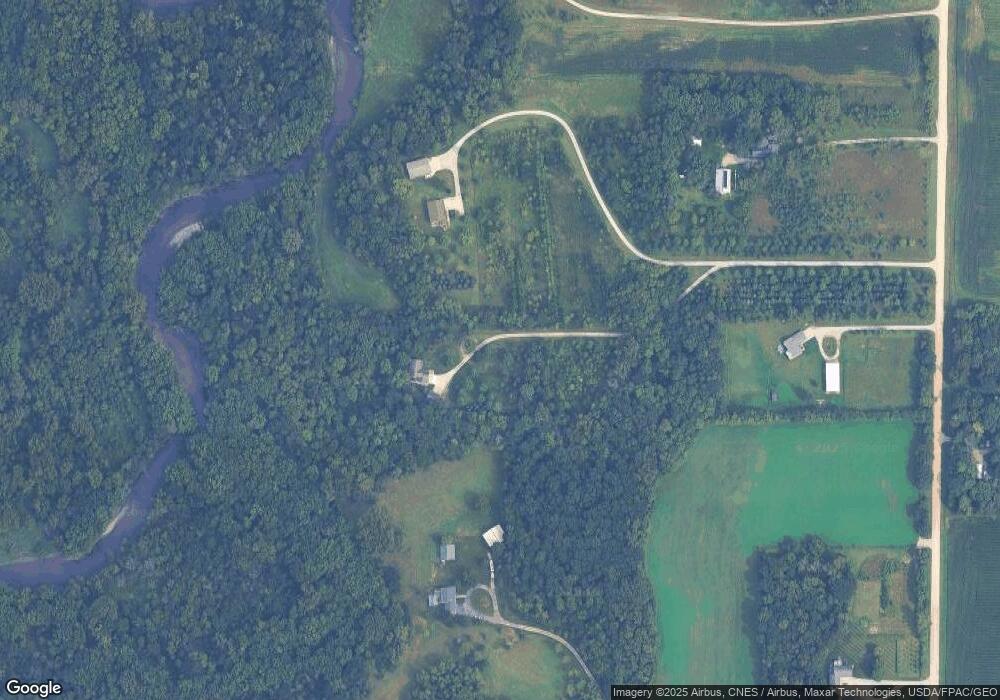
Map
Nearby Homes
- 8292 Cabot Ave
- 305 2nd St NE
- 22 5th St SE
- 209 E Central Ave
- 320 6th St SE
- 567 Forest Ln
- 107 2nd St SW
- 204 2nd Ave SW
- 303 3rd Ave SW
- 209 4th Ave SW
- Lots XXX of Divine Mercy
- 1507 Babbitt Ct
- 1406 Albers Path
- 4680 NW 66th St
- 1320 S Trail Dr Unit 41
- 1724 Prairie Ave SW
- 561 12th St SW
- 1070 Willow St
- 949 Rice St
- 1435 Springwood Ln
- 25920 Dahle Ave
- 25656 Dahle Ave
- 25980 Dahle Ave
- 25756 Dahle Ave
- 25636 Dahle Ave
- 25606 Dahle Ave
- 25950 Dahle Ave
- 25823 Dahle Ave
- 26048 Dahle Ave
- 25310 Dahle Ave
- 25404 Dahle Ave
- 25394 Dahle Ave
- 3856 263rd St E
- 3908 263rd St E
- 25374 Dahle Ave
- 4167 260th St E
- 25250 Dahle Ave
- 4233 260th St E
- 26475 Coe Ave
- 4289 255th St E
Your Personal Tour Guide
Ask me questions while you tour the home.