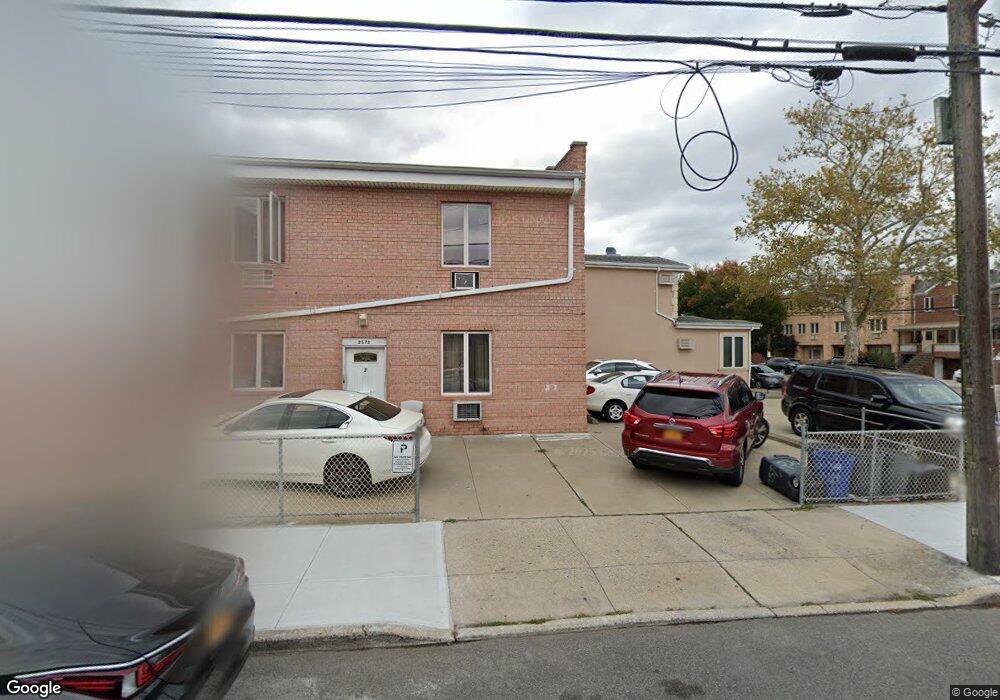
2573 E 11th St Brooklyn, NY 11235
Sheepshead Bay NeighborhoodEstimated Value: $1,234,000 - $1,369,000
Studio
--
Bath
2,166
Sq Ft
$613/Sq Ft
Est. Value
About This Home
This home is located at 2573 E 11th St, Brooklyn, NY 11235 and is currently estimated at $1,328,002, approximately $613 per square foot. 2573 E 11th St is a home located in Kings County with nearby schools including P.S. 209 Margaret Mead, P.S. K225 - The Eileen E. Zaglin School, and Ahi Ezer Yeshiva School.
Ownership History
Date
Name
Owned For
Owner Type
Purchase Details
Closed on
Nov 20, 2020
Sold by
Agres Mark and Agres Regina
Bought by
2573 East 11 Street Llc
Current Estimated Value
Purchase Details
Closed on
May 8, 2020
Sold by
2573 East 11 Street Llc
Bought by
Agres Mark and Agres Regina
Home Financials for this Owner
Home Financials are based on the most recent Mortgage that was taken out on this home.
Original Mortgage
$25,813
Interest Rate
3.3%
Mortgage Type
Unknown
Purchase Details
Closed on
Sep 23, 2016
Sold by
Agres Mark
Bought by
2573 East 11 Street Llc
Purchase Details
Closed on
Jul 28, 2015
Sold by
Moskowitz Revital
Bought by
Agres Mark and Agres Regina
Home Financials for this Owner
Home Financials are based on the most recent Mortgage that was taken out on this home.
Original Mortgage
$633,000
Interest Rate
4.08%
Mortgage Type
Purchase Money Mortgage
Create a Home Valuation Report for This Property
The Home Valuation Report is an in-depth analysis detailing your home's value as well as a comparison with similar homes in the area
Home Values in the Area
Average Home Value in this Area
Purchase History
| Date | Buyer | Sale Price | Title Company |
|---|---|---|---|
| 2573 East 11 Street Llc | -- | -- | |
| Agres Mark | -- | -- | |
| 2573 East 11 Street Llc | -- | -- | |
| Agres Mark | $975,000 | -- |
Source: Public Records
Mortgage History
| Date | Status | Borrower | Loan Amount |
|---|---|---|---|
| Previous Owner | Agres Mark | $25,813 | |
| Previous Owner | Agres Mark | $633,000 |
Source: Public Records
Tax History
| Year | Tax Paid | Tax Assessment Tax Assessment Total Assessment is a certain percentage of the fair market value that is determined by local assessors to be the total taxable value of land and additions on the property. | Land | Improvement |
|---|---|---|---|---|
| 2025 | $11,453 | $63,420 | $19,260 | $44,160 |
| 2024 | $11,453 | $68,100 | $19,260 | $48,840 |
| 2023 | $11,448 | $79,980 | $19,260 | $60,720 |
| 2022 | $7,994 | $71,280 | $19,260 | $52,020 |
| 2021 | $10,601 | $60,060 | $19,260 | $40,800 |
| 2020 | $7,486 | $68,520 | $19,260 | $49,260 |
| 2019 | $9,941 | $68,160 | $19,260 | $48,900 |
| 2018 | $9,576 | $46,976 | $13,860 | $33,116 |
| 2017 | $9,070 | $44,494 | $13,336 | $31,158 |
| 2016 | $8,391 | $41,976 | $15,382 | $26,594 |
| 2015 | $5,089 | $39,600 | $20,640 | $18,960 |
| 2014 | $5,089 | $39,600 | $20,640 | $18,960 |
Source: Public Records
Map
Nearby Homes
- 1213 Avenue Z Unit E2
- 1213 Avenue Z Unit B19
- 1213 Avenue Z Unit D24
- 1213 Avenue Z Unit F33
- 1213 Avenue Z Unit C39
- 1213 Avenue Z Unit F4
- 1213 Avenue Z Unit C13
- 2626 Homecrest Ave Unit 7K
- 2626 Homecrest Ave Unit 1S
- 2626 Homecrest Ave Unit 5
- 2626 Homecrest Ave Unit 1U
- 2626 Homecrest Ave Unit 3P
- 734 Kathleen Place
- 2648 E 11th St
- 2776 Coney Island Ave
- 1237 Avenue Z Unit 4D
- 1237 Avenue Z Unit NN
- 1237 Avenue Z Unit 5E
- 1237 Avenue Z Unit 6U
- 1237 Avenue Z Unit NN
- 1105 Avenue Z
- 1107 Avenue Z
- 1111 Avenue Z
- 1111 Avenue Z Unit 2
- 1111 Avenue Z Unit 1
- 2569 E 11th St
- 1021-1023 Avenue Z
- 2565 E 11th St
- 2565 E 11th St Unit 1
- 2565 E 11 St
- 1115 Avenue Z
- 1019 Avenue Z
- 1117 Avenue Z
- 2601 E 11th St
- 2563 E 11th St Unit 3
- 2563 E 11th St Unit 2
- 2563 E 11th St Unit 1
- 2563 E 11th St
- 2570 E 11th St
- 1121 Avenue Z
Your Personal Tour Guide
Ask me questions while you tour the home.