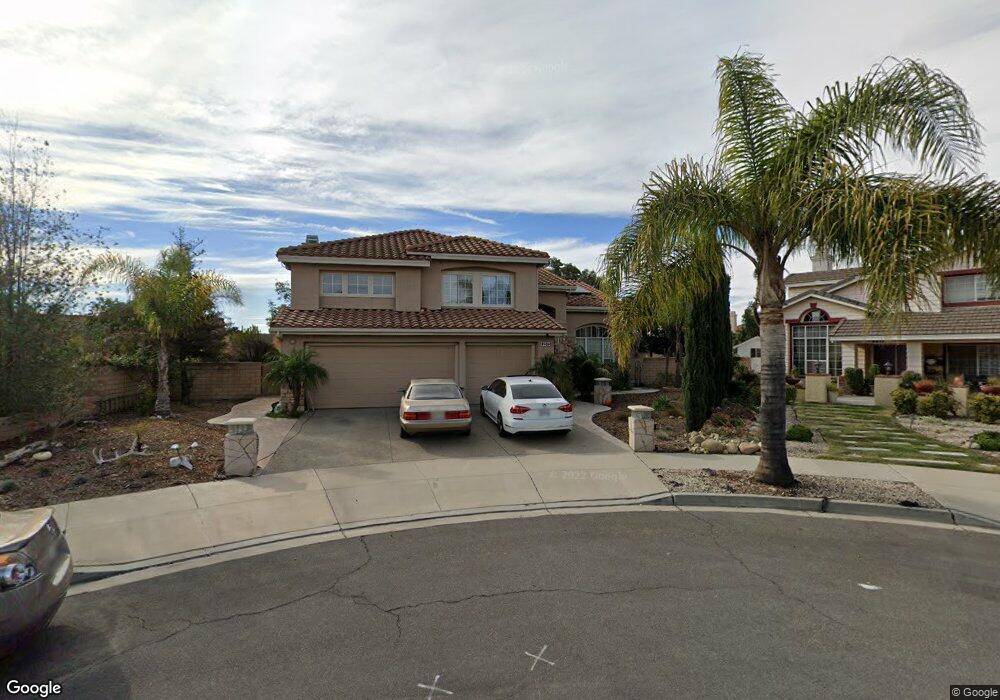
2573 Joshua Ct Oxnard, CA 93036
South Bank NeighborhoodEstimated Value: $880,000 - $1,158,000
About This Home
This home is located at 2573 Joshua Ct, Oxnard, CA 93036 and is currently estimated at $1,046,347, approximately $448 per square foot. 2573 Joshua Ct is a home located in Ventura County with nearby schools including Rio Del Norte Elementary School, Rio Vista Middle School, and Rio Mesa High School.
Ownership History
We collect this data history from publicly available records. To have your information removed, we recommend requesting removal directly through your county’s website.
Purchase Details
Purchase Details
Home Values in the Area
Average Home Value in this Area
Purchase History
We collect this data history from publicly available records. To have your information removed, we recommend requesting removal directly through your county’s website.
| Date | Buyer | Sale Price | Title Company |
|---|---|---|---|
| $298,000 | Lawyers Title Company | ||
| -- | -- |
Mortgage History
We collect this data history from publicly available records. To have your information removed, we recommend requesting removal directly through your county’s website.
| Date | Status | Borrower | Loan Amount |
|---|---|---|---|
| Open | $447,000 | ||
| Closed | $14,681 | ||
| Closed | $317,664 | ||
| Closed | $15,614 |
Tax History
We collect this data history from publicly available records. To have your information removed, we recommend requesting removal directly through your county’s website.
| Year | Tax Paid | Tax Assessment Tax Assessment Total Assessment is a certain percentage of the fair market value that is determined by local assessors to be the total taxable value of land and additions on the property. | Land | Improvement |
|---|---|---|---|---|
| 2025 | $5,522 | $467,147 | $186,857 | $280,290 |
| 2024 | $5,522 | $457,988 | $183,193 | $274,795 |
| 2023 | $5,285 | $449,008 | $179,601 | $269,407 |
| 2022 | $5,133 | $440,204 | $176,079 | $264,125 |
| 2021 | $5,242 | $431,573 | $172,626 | $258,947 |
| 2020 | $5,350 | $427,150 | $170,857 | $256,293 |
| 2019 | $5,136 | $418,775 | $167,507 | $251,268 |
| 2018 | $4,966 | $410,565 | $164,223 | $246,342 |
| 2017 | $4,835 | $402,515 | $161,003 | $241,512 |
| 2016 | $4,584 | $394,624 | $157,847 | $236,777 |
| 2015 | $4,704 | $388,698 | $155,477 | $233,221 |
| 2014 | $4,504 | $381,086 | $152,433 | $228,653 |
Map
- 2581 Lake Dr
- 749 Winchester Dr
- 613 Winchester Dr
- 2485 Elderberry Dr Unit 43
- 501 Winchester Dr
- 2870 Wagon Wheel Rd Unit 203
- 2820 Wagon Wheel Rd Unit 403
- 2800 Wagon Wheel Rd Unit 304
- 1625 Range Rd
- 2810 Wagon Wheel Rd Unit 402
- 1600 Mulligan St
- 1340 Kumquat Place
- 2475 Apple Ln Unit 129
- 637 Holly Ave
- 1510 Holly Ave
- 1600 Holly Ave
- 2208 N H St
- 2151 Olga St
- 2704 Riverpark Blvd
- 262 W Vineyard Ave
- 2627 Kentia St
- 2617 Kentia St
- 2637 Kentia St
- 2546 Lake Dr
- 2536 Lake Dr
- 2556 Lake Dr
- 2647 Kentia St
- 2621 Woodside Place
- 2611 Woodside Place
- 2628 Kentia St
- 2566 Lake Dr
- 2618 Kentia St
- 2638 Kentia St
- 2601 Woodside Place
- 2608 Kentia St
- 2657 Kentia St
- 2576 Lake Dr
- 2648 Kentia St
- 2600 Kentia St
- 2551 Lake Dr
Ask me questions while you tour the home.