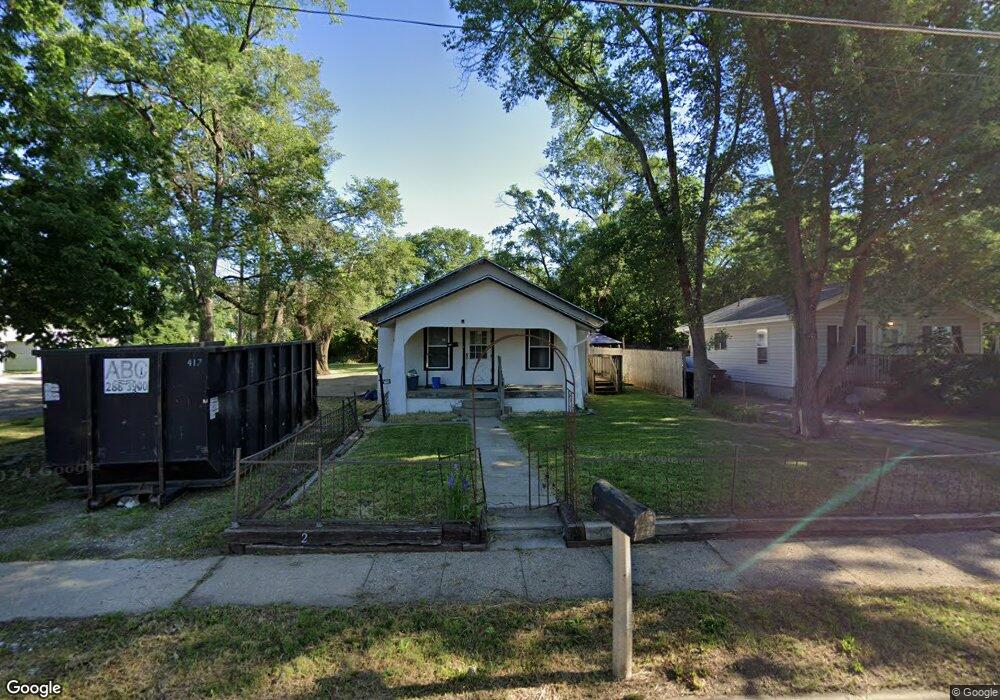
2574 Onawa St Des Moines, IA 50317
Chesterfield NeighborhoodEstimated Value: $83,000 - $289,000
2
Beds
2
Baths
1,117
Sq Ft
$146/Sq Ft
Est. Value
About This Home
This home is located at 2574 Onawa St, Des Moines, IA 50317 and is currently estimated at $163,029, approximately $145 per square foot. 2574 Onawa St is a home located in Polk County with nearby schools including Willard Elementary School, Hoyt Middle School, and East High School.
Ownership History
Date
Name
Owned For
Owner Type
Purchase Details
Closed on
Apr 24, 2024
Sold by
Limon Fabiola and Ali Usman
Bought by
Coreas Jose Emilio Lara
Current Estimated Value
Purchase Details
Closed on
Jan 10, 2002
Sold by
Harrison Charlotte and Harrison Stephen
Bought by
Harrison Stephen and Harrison Charlotte
Purchase Details
Closed on
Feb 20, 1998
Sold by
Beeson Keith
Bought by
Harrison Charlotte
Purchase Details
Closed on
Mar 6, 1987
Sold by
Beeman Ben G and Beeman Caroline
Bought by
Beeson Keith Allan
Create a Home Valuation Report for This Property
The Home Valuation Report is an in-depth analysis detailing your home's value as well as a comparison with similar homes in the area
Home Values in the Area
Average Home Value in this Area
Purchase History
| Date | Buyer | Sale Price | Title Company |
|---|---|---|---|
| Coreas Jose Emilio Lara | $74,000 | None Listed On Document | |
| Harrison Stephen | -- | -- | |
| Harrison Charlotte | -- | -- | |
| Beeson Keith Allan | $14,500 | -- |
Source: Public Records
Tax History Compared to Growth
Tax History
| Year | Tax Paid | Tax Assessment Tax Assessment Total Assessment is a certain percentage of the fair market value that is determined by local assessors to be the total taxable value of land and additions on the property. | Land | Improvement |
|---|---|---|---|---|
| 2025 | $1,468 | $95,300 | $8,700 | $86,600 |
| 2024 | $1,468 | $93,700 | $7,500 | $86,200 |
| 2023 | $1,554 | $93,700 | $7,500 | $86,200 |
| 2022 | $1,540 | $78,200 | $6,600 | $71,600 |
| 2021 | $1,416 | $78,200 | $6,600 | $71,600 |
| 2020 | $1,462 | $68,600 | $5,800 | $62,800 |
| 2019 | $1,266 | $68,600 | $5,800 | $62,800 |
| 2018 | $1,246 | $58,900 | $5,000 | $53,900 |
| 2017 | $1,216 | $58,900 | $5,000 | $53,900 |
| 2016 | $1,176 | $56,700 | $4,700 | $52,000 |
| 2015 | $1,176 | $56,700 | $4,700 | $52,000 |
| 2014 | $1,160 | $55,700 | $4,600 | $51,100 |
Source: Public Records
Map
Nearby Homes