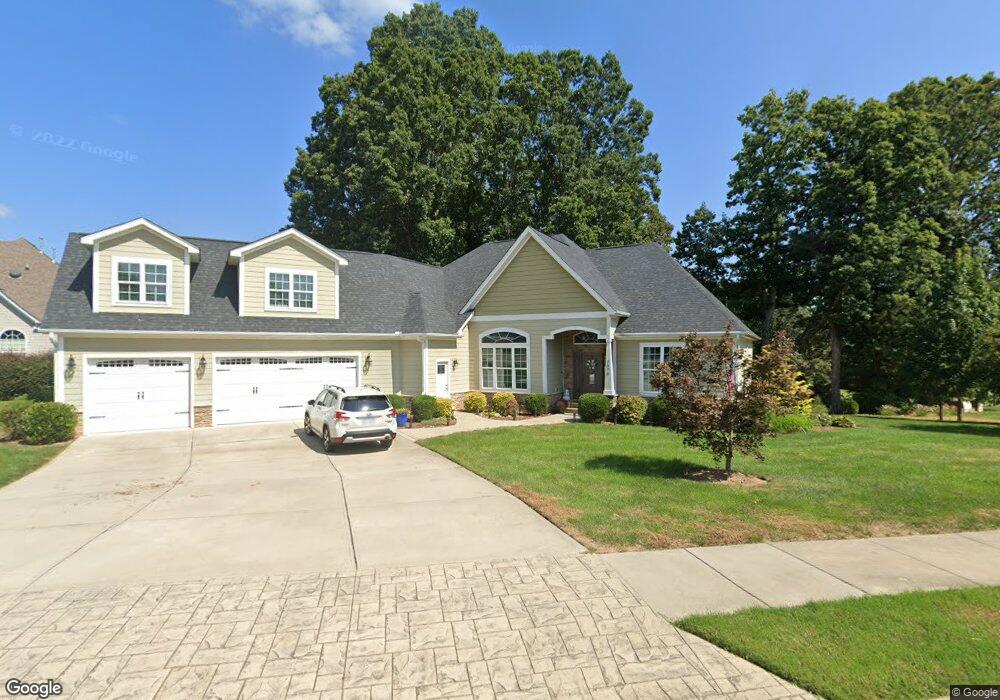
2575 Shanklin Ln S Unit 13 Denver, NC 28037
Estimated Value: $792,000 - $859,000
4
Beds
4
Baths
3,232
Sq Ft
$253/Sq Ft
Est. Value
About This Home
This home is located at 2575 Shanklin Ln S Unit 13, Denver, NC 28037 and is currently estimated at $816,716, approximately $252 per square foot. 2575 Shanklin Ln S Unit 13 is a home located in Lincoln County with nearby schools including St. James Elementary School, North Lincoln Middle School, and North Lincoln High School.
Ownership History
Date
Name
Owned For
Owner Type
Purchase Details
Closed on
Aug 20, 2024
Sold by
Badgley Mark and Badgley Janelyn
Bought by
Dopman William and Dopman Janice
Current Estimated Value
Purchase Details
Closed on
Dec 2, 2021
Sold by
Wietholter Bradley D and Wietholter Rosemary
Bought by
Badgley Mark and Badgley Janelyn
Home Financials for this Owner
Home Financials are based on the most recent Mortgage that was taken out on this home.
Original Mortgage
$541,000
Interest Rate
3.09%
Mortgage Type
New Conventional
Purchase Details
Closed on
Jul 8, 2015
Sold by
Orndorff Wayne C and Tilley Rumiko K
Bought by
Wietholter Bradley D and Wietholter Rosemary
Home Financials for this Owner
Home Financials are based on the most recent Mortgage that was taken out on this home.
Original Mortgage
$275,000
Interest Rate
4.5%
Mortgage Type
Adjustable Rate Mortgage/ARM
Purchase Details
Closed on
Mar 20, 2012
Sold by
Branch Banking & Trust Company
Bought by
Tilley Rumiko K
Create a Home Valuation Report for This Property
The Home Valuation Report is an in-depth analysis detailing your home's value as well as a comparison with similar homes in the area
Home Values in the Area
Average Home Value in this Area
Purchase History
| Date | Buyer | Sale Price | Title Company |
|---|---|---|---|
| Dopman William | $810,000 | None Listed On Document | |
| Badgley Mark | $681,000 | None Available | |
| Wietholter Bradley D | $425,000 | None Available | |
| Tilley Rumiko K | $30,000 | None Available |
Source: Public Records
Mortgage History
| Date | Status | Borrower | Loan Amount |
|---|---|---|---|
| Previous Owner | Badgley Mark | $541,000 | |
| Previous Owner | Wietholter Bradley D | $275,000 |
Source: Public Records
Tax History
| Year | Tax Paid | Tax Assessment Tax Assessment Total Assessment is a certain percentage of the fair market value that is determined by local assessors to be the total taxable value of land and additions on the property. | Land | Improvement |
|---|---|---|---|---|
| 2025 | $4,518 | $724,915 | $116,500 | $608,415 |
| 2024 | $4,294 | $694,102 | $116,500 | $577,602 |
| 2023 | $4,294 | $694,102 | $116,500 | $577,602 |
| 2022 | $3,684 | $482,920 | $76,000 | $406,920 |
| 2021 | $3,708 | $482,920 | $76,000 | $406,920 |
| 2020 | $3,366 | $482,920 | $76,000 | $406,920 |
| 2019 | $3,366 | $482,920 | $76,000 | $406,920 |
| 2018 | $2,999 | $413,969 | $69,000 | $344,969 |
| 2017 | $2,898 | $413,969 | $69,000 | $344,969 |
| 2016 | $2,885 | $413,969 | $69,000 | $344,969 |
| 2015 | $466 | $0 | $0 | $0 |
| 2014 | $466 | $68,000 | $68,000 | $0 |
Source: Public Records
Map
Nearby Homes
- 2576 Shanklin Ln S
- #98 Silver Trace Ln
- #92 Silver Trace Ln
- 101 Silver Trace Ln Unit 101
- 6197 Gold Springs Way
- 30 Shanklin Ln S Unit 30
- 32 Shanklin Ln S Unit 32
- 6193 Gold Springs Way
- 1140 Golden Hill Ln
- 3489 Lake Shore Rd S
- 8032 Lakeview Dr
- 3101 Three Wood Dr
- 3695 Lake Shore Rd S
- 1178 Almerton Dr
- 2474 Green Point Ln
- 3267 Miners Cove Ct
- 2550 Green Point Ln
- 6859 Lakecrest Ct
- 7795 Old Post Rd
- 2378 Smith Harbour Dr
- 2575 Shanklin Ln S
- Lot8 S Golf Course Dr Unit 8
- lot 2 S Golf Course Dr
- Lot 8 S Golf Course Dr
- Lot 8 S Golf Course Dr Unit 8
- Lot 4 S Golf Course Dr
- Lot 8 S Golf Course Dr Unit Lot 8
- 2588 Shanklin Ln S
- 7418 Golf Course Dr S
- 2594 Shanklin Ln S
- 2546 Shanklin Ln S
- Lot 3 S Golf Course Dr
- lot 5 S Golf Course Dr
- Lot 9 S Golf Course Dr
- Lot 3 S Golf Course Dr Unit 3
- Lot 9 S Golf Course Dr Unit Lot 9
- 2565 Shanklin Ln S Unit 2
- 2601 Shanklin Ln S
- 2601 Shanklin Ln S Unit 15
- 7428 Golf Course Dr S
Your Personal Tour Guide
Ask me questions while you tour the home.