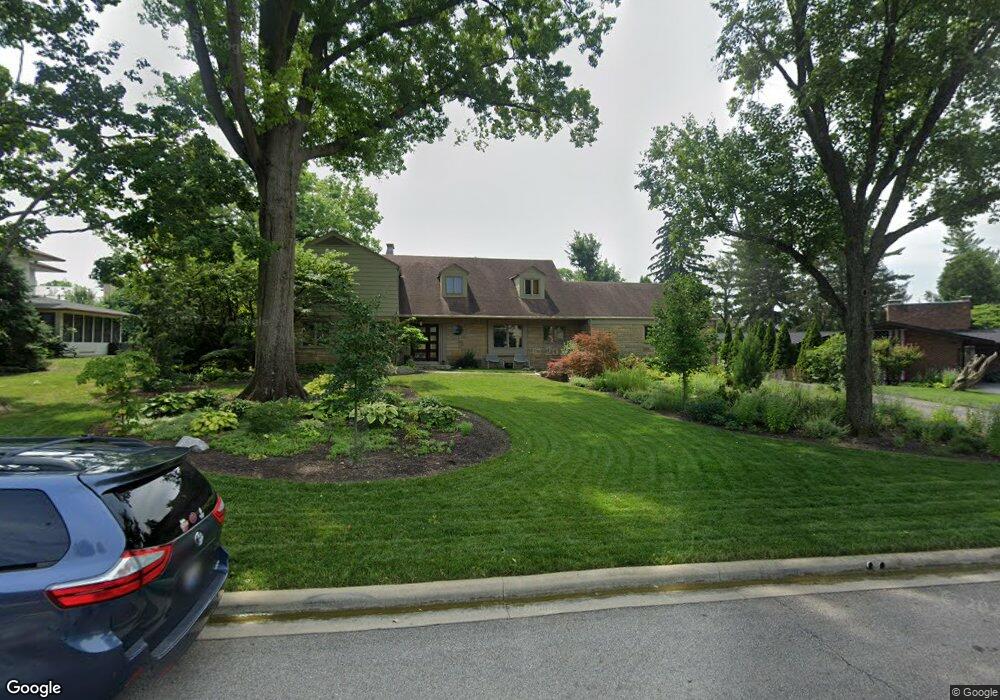
2575 Sherwin Rd Columbus, OH 43221
Estimated Value: $1,253,000 - $1,587,213
5
Beds
4
Baths
3,520
Sq Ft
$408/Sq Ft
Est. Value
About This Home
This home is located at 2575 Sherwin Rd, Columbus, OH 43221 and is currently estimated at $1,437,053, approximately $408 per square foot. 2575 Sherwin Rd is a home located in Franklin County with nearby schools including Tremont Elementary School, Jones Middle School, and Upper Arlington High School.
Ownership History
Date
Name
Owned For
Owner Type
Purchase Details
Closed on
Aug 14, 2018
Sold by
Leach Christina S
Bought by
Leach Christina S and The Christina S Leach Trust
Current Estimated Value
Purchase Details
Closed on
May 11, 2005
Sold by
Rockey Nancy S and Celio Judith S
Bought by
Leach John M and Leach Christina S
Home Financials for this Owner
Home Financials are based on the most recent Mortgage that was taken out on this home.
Original Mortgage
$480,000
Outstanding Balance
$247,454
Interest Rate
6.07%
Mortgage Type
Fannie Mae Freddie Mac
Estimated Equity
$1,189,599
Purchase Details
Closed on
Jul 18, 2000
Sold by
Stine George T
Bought by
Stine George T and George T Stine Qualified Perso
Create a Home Valuation Report for This Property
The Home Valuation Report is an in-depth analysis detailing your home's value as well as a comparison with similar homes in the area
Home Values in the Area
Average Home Value in this Area
Purchase History
| Date | Buyer | Sale Price | Title Company |
|---|---|---|---|
| Leach Christina S | -- | None Available | |
| Leach Christina S | -- | None Available | |
| Leach John M | $300,000 | -- | |
| Leach John M | $300,000 | -- | |
| Stine George T | -- | -- | |
| Stine Jean | -- | -- | |
| Stine Jean | -- | -- |
Source: Public Records
Mortgage History
| Date | Status | Borrower | Loan Amount |
|---|---|---|---|
| Open | Leach John M | $480,000 | |
| Closed | Leach John M | $480,000 |
Source: Public Records
Tax History
| Year | Tax Paid | Tax Assessment Tax Assessment Total Assessment is a certain percentage of the fair market value that is determined by local assessors to be the total taxable value of land and additions on the property. | Land | Improvement |
|---|---|---|---|---|
| 2025 | $22,676 | $391,690 | $155,400 | $236,290 |
| 2024 | $22,676 | $391,690 | $155,400 | $236,290 |
| 2023 | $22,395 | $391,690 | $155,400 | $236,290 |
| 2022 | $24,014 | $343,460 | $128,100 | $215,360 |
| 2021 | $21,245 | $343,460 | $128,100 | $215,360 |
| 2020 | $21,057 | $343,460 | $128,100 | $215,360 |
| 2019 | $20,785 | $299,740 | $128,100 | $171,640 |
| 2018 | $17,404 | $299,740 | $128,100 | $171,640 |
| 2017 | $20,334 | $295,510 | $128,100 | $167,410 |
| 2016 | $14,153 | $214,060 | $86,310 | $127,750 |
| 2015 | $14,141 | $214,060 | $86,310 | $127,750 |
| 2014 | $14,157 | $214,060 | $86,310 | $127,750 |
| 2013 | $6,760 | $194,600 | $78,470 | $116,130 |
Source: Public Records
Map
Nearby Homes
- 2593 Olde Hill Ct N Unit D2593
- 2827 Katmai Dr
- The Sierra Plan at Quarry Trails - Single Family Homes
- The Aspen Plan at Quarry Trails - Single Family Homes
- The Whitney Plan at Quarry Trails - Single Family Homes
- 2833 Katmai Dr
- 2808 Kobuk Dr
- 2835 Katmai Dr
- 2800 Kobuk Dr
- 2841 Katmai Dr
- 2806 Kobuk Dr
- 2845 Katmai Dr
- 2979 Avalon Rd
- 2851 Katmai Dr
- 2812 Kobuk Dr
- 2828 Kobuk Dr
- 2853 Katmai Dr
- 2748 Tremont Rd
- 2782 Chateau Cir S Unit 45
- 2832 Kobuk Dr
- 2589 Sherwin Rd
- 2561 Sherwin Rd
- 2558 Onandaga Dr
- 2628 Sherwin Rd
- 2548 Onandaga Dr
- 2601 Sherwin Rd
- 2545 Sherwin Rd
- 2570 Onandaga Dr
- 2538 Onandaga Dr
- 2580 Sherwin Rd
- 2568 Sherwin Rd
- 2580 Onandaga Dr
- 2528 Onandaga Dr
- 2546 Sherwin Rd
- 2610 Sherwin Rd
- 2613 Sherwin Rd
- 2531 Sherwin Rd
- 2530 Onandaga Dr
- 2516 Onandaga Dr
- 2545 Onandaga Dr