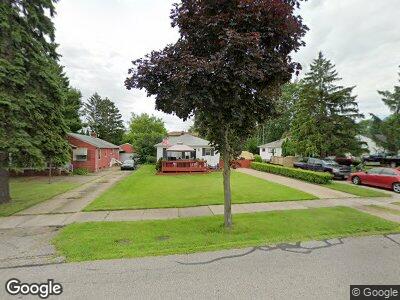
25779 Garfield Ave Olmsted Falls, OH 44138
Estimated Value: $190,080 - $278,000
3
Beds
1
Bath
988
Sq Ft
$220/Sq Ft
Est. Value
About This Home
This home is located at 25779 Garfield Ave, Olmsted Falls, OH 44138 and is currently estimated at $217,770, approximately $220 per square foot. 25779 Garfield Ave is a home located in Cuyahoga County with nearby schools including Falls-Lenox Primary Elementary School, Olmsted Falls Intermediate Building, and Olmsted Falls Middle School.
Ownership History
Date
Name
Owned For
Owner Type
Purchase Details
Closed on
Jan 26, 2022
Bought by
Spies Kelley A
Current Estimated Value
Purchase Details
Closed on
Apr 26, 2021
Bought by
Spies Kelley A
Purchase Details
Closed on
Jul 17, 2000
Sold by
Hoag Veda M
Bought by
Spies Daryl R and Spies Kelley A
Home Financials for this Owner
Home Financials are based on the most recent Mortgage that was taken out on this home.
Original Mortgage
$109,140
Interest Rate
8.31%
Mortgage Type
VA
Purchase Details
Closed on
Apr 3, 1985
Sold by
William J Hoag
Bought by
Veda M Hoag
Purchase Details
Closed on
Nov 8, 1978
Sold by
Hoag William J and Hoag Veda M
Bought by
William J Hoag
Purchase Details
Closed on
Jan 1, 1975
Bought by
Hoag William J and Hoag Veda M
Create a Home Valuation Report for This Property
The Home Valuation Report is an in-depth analysis detailing your home's value as well as a comparison with similar homes in the area
Home Values in the Area
Average Home Value in this Area
Purchase History
| Date | Buyer | Sale Price | Title Company |
|---|---|---|---|
| Spies Daryl R | $107,000 | Resource Title Agency Inc | |
| Veda M Hoag | -- | -- | |
| William J Hoag | -- | -- | |
| Hoag William J | -- | -- |
Source: Public Records
Mortgage History
| Date | Status | Borrower | Loan Amount |
|---|---|---|---|
| Previous Owner | Spies Daryl R | $122,250 | |
| Previous Owner | Spies Daryl R | $116,650 | |
| Previous Owner | Spies Daryl R | $109,140 |
Source: Public Records
Tax History Compared to Growth
Tax History
| Year | Tax Paid | Tax Assessment Tax Assessment Total Assessment is a certain percentage of the fair market value that is determined by local assessors to be the total taxable value of land and additions on the property. | Land | Improvement |
|---|---|---|---|---|
| 2024 | $4,900 | $74,585 | $9,940 | $64,645 |
| 2023 | $3,870 | $47,710 | $10,290 | $37,420 |
| 2022 | $3,833 | $47,710 | $10,290 | $37,420 |
| 2021 | $3,794 | $47,710 | $10,290 | $37,420 |
| 2020 | $3,435 | $38,150 | $8,230 | $29,930 |
| 2019 | $3,050 | $109,000 | $23,500 | $85,500 |
| 2018 | $3,047 | $38,150 | $8,230 | $29,930 |
| 2017 | $3,403 | $39,690 | $8,820 | $30,870 |
| 2016 | $3,385 | $39,690 | $8,820 | $30,870 |
| 2015 | $3,395 | $39,690 | $8,820 | $30,870 |
| 2014 | $3,395 | $36,760 | $8,160 | $28,600 |
Source: Public Records
Map
Nearby Homes
- 7985 Brookside Dr
- 8158 Lynway Ave
- 25078 Mill River Rd Unit 25078
- 8290 Metropolitan Blvd
- 281-12-024 River Rd
- 281-12-007 River Rd
- 26767 Cranage Rd
- 3 Lees Ln
- 8416 Falls Glen Dr
- 8638 Graham Cir
- 8 Maple Dr
- 44 Periwinkle Dr
- 17 Oak Dr
- 26788 Skyline Dr
- 7684 Fitch Rd
- 89 Parkway Dr
- 61 Periwinkle Dr
- 0 River Rd Unit 4424129
- 85 Periwinkle Dr
- 7587 Lewis Rd
- 25779 Garfield Ave
- 25795 Garfield Ave
- 25763 Garfield Ave
- 8122 Brookside Dr
- 25813 Garfield Ave
- 8130 Brookside Dr
- 25831 Garfield Ave
- 8075 Olmway Ave
- 25748 Garfield Ave
- 8138 Brookside Dr
- 8066 Brookside Dr
- 8092 Brookside Dr
- 25847 Garfield Ave
- 8085 Olmway Ave
- 8146 Brookside Dr
- 25761 Mill St
- 8121 Olmway Ave
- 8154 Brookside Dr
- 25919 Garfield Ave
- 25717 Mill St