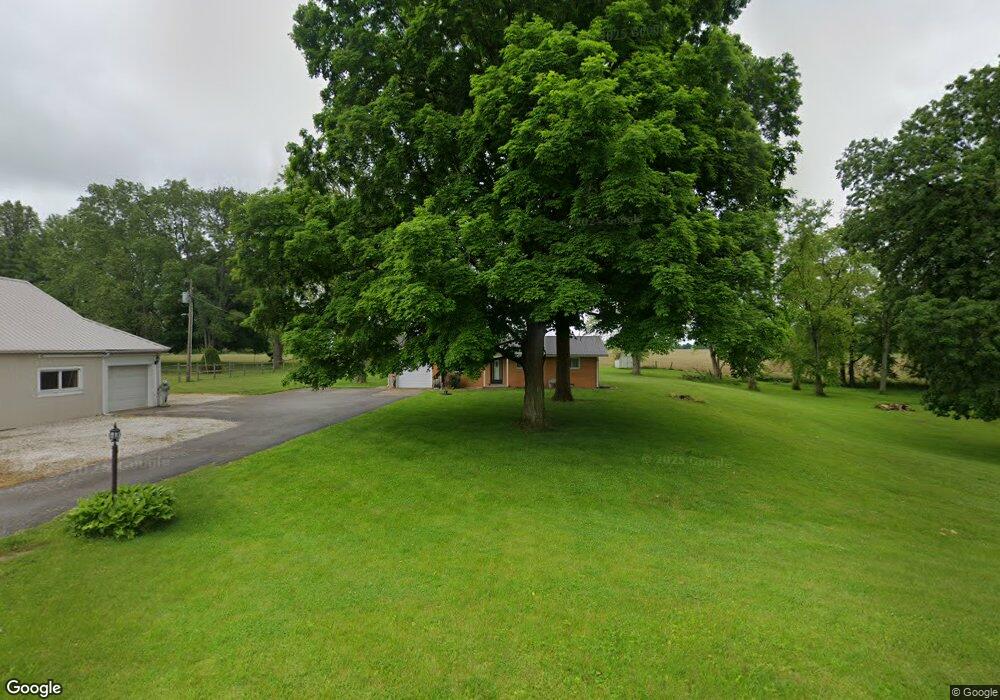
2578 S 1100 E Greentown, IN 46936
Estimated Value: $204,000 - $277,000
3
Beds
2
Baths
1,425
Sq Ft
$167/Sq Ft
Est. Value
About This Home
This home is located at 2578 S 1100 E, Greentown, IN 46936 and is currently estimated at $238,322, approximately $167 per square foot. 2578 S 1100 E is a home located in Howard County with nearby schools including Eastern Elementary School and Eastern High School.
Ownership History
Date
Name
Owned For
Owner Type
Purchase Details
Closed on
May 2, 2022
Sold by
Davis James J
Bought by
Davis Hope R
Current Estimated Value
Home Financials for this Owner
Home Financials are based on the most recent Mortgage that was taken out on this home.
Original Mortgage
$160,000
Outstanding Balance
$131,112
Interest Rate
3.39%
Mortgage Type
Credit Line Revolving
Estimated Equity
$107,210
Create a Home Valuation Report for This Property
The Home Valuation Report is an in-depth analysis detailing your home's value as well as a comparison with similar homes in the area
Home Values in the Area
Average Home Value in this Area
Purchase History
| Date | Buyer | Sale Price | Title Company |
|---|---|---|---|
| Davis Hope R | -- | None Listed On Document |
Source: Public Records
Mortgage History
| Date | Status | Borrower | Loan Amount |
|---|---|---|---|
| Open | Davis Hope R | $160,000 |
Source: Public Records
Tax History Compared to Growth
Tax History
| Year | Tax Paid | Tax Assessment Tax Assessment Total Assessment is a certain percentage of the fair market value that is determined by local assessors to be the total taxable value of land and additions on the property. | Land | Improvement |
|---|---|---|---|---|
| 2024 | $1,173 | $183,600 | $33,500 | $150,100 |
| 2022 | $1,245 | $156,200 | $32,500 | $123,700 |
| 2021 | $1,064 | $146,000 | $29,000 | $117,000 |
| 2020 | $848 | $132,700 | $29,000 | $103,700 |
| 2019 | $718 | $124,800 | $29,400 | $95,400 |
| 2018 | $752 | $117,300 | $29,500 | $87,800 |
| 2017 | $778 | $114,800 | $27,200 | $87,600 |
| 2016 | $717 | $111,100 | $27,300 | $83,800 |
| 2014 | $706 | $116,300 | $27,400 | $88,900 |
| 2013 | $575 | $101,900 | $27,000 | $74,900 |
Source: Public Records
Map
Nearby Homes
- 8937 E 300 S
- 71 S 1100 E
- 1009 Eastcrest Dr
- 1125 Robin Ct
- 3893 E 650 N
- 312 S Meridian St
- 524 E Grant St
- 9502 W 800 S
- 228 N Indiana St
- 228 E Railroad St
- 204 E Blaine St
- 329 W Grant St
- 405 N Green St
- 13972 County Road East 500 S
- 9391 E 100 N
- 128 W High St
- 408 W Payton St
- 8898,8924,8948 E 100 N
- 8011 S 800 W
- 7810 E 50 N