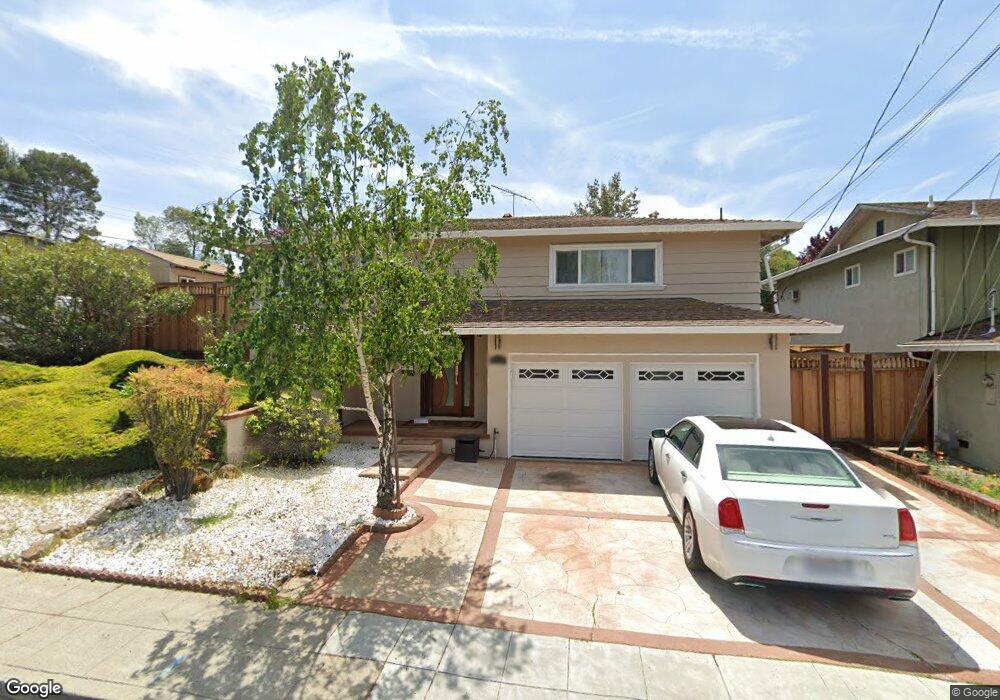
2579 Ralston Way Hayward, CA 94541
Estimated Value: $921,679 - $965,000
3
Beds
2
Baths
1,411
Sq Ft
$664/Sq Ft
Est. Value
About This Home
This home is located at 2579 Ralston Way, Hayward, CA 94541 and is currently estimated at $936,920, approximately $664 per square foot. 2579 Ralston Way is a home located in Alameda County with nearby schools including Fairview Elementary School, Bret Harte Middle School, and Hayward High School.
Ownership History
Date
Name
Owned For
Owner Type
Purchase Details
Closed on
Feb 17, 2022
Sold by
Fubara Jane
Bought by
Fubara Michael and Fubara Jane
Current Estimated Value
Purchase Details
Closed on
Sep 23, 2005
Sold by
Fubara Michael and Fubara Jane
Bought by
Fubara Jane
Purchase Details
Closed on
Jul 3, 2003
Sold by
Walker Sheila C
Bought by
Fubara Michael and Fubara Jane
Home Financials for this Owner
Home Financials are based on the most recent Mortgage that was taken out on this home.
Original Mortgage
$387,600
Interest Rate
5.18%
Mortgage Type
Purchase Money Mortgage
Purchase Details
Closed on
Jun 20, 1997
Sold by
Rickman Gary L and Rickman Gwen L
Bought by
Walker Sheila C
Home Financials for this Owner
Home Financials are based on the most recent Mortgage that was taken out on this home.
Original Mortgage
$139,200
Interest Rate
7.91%
Create a Home Valuation Report for This Property
The Home Valuation Report is an in-depth analysis detailing your home's value as well as a comparison with similar homes in the area
Home Values in the Area
Average Home Value in this Area
Purchase History
| Date | Buyer | Sale Price | Title Company |
|---|---|---|---|
| Fubara Michael | -- | None Listed On Document | |
| Fubara Jane | $248,000 | Alliance Title Company | |
| Fubara Michael | $408,000 | Ticor Title Company Of Ca | |
| Walker Sheila C | $174,000 | Old Republic Title Company |
Source: Public Records
Mortgage History
| Date | Status | Borrower | Loan Amount |
|---|---|---|---|
| Previous Owner | Fubara Michael | $387,600 | |
| Previous Owner | Walker Sheila C | $139,200 | |
| Closed | Walker Sheila C | $17,400 |
Source: Public Records
Tax History Compared to Growth
Tax History
| Year | Tax Paid | Tax Assessment Tax Assessment Total Assessment is a certain percentage of the fair market value that is determined by local assessors to be the total taxable value of land and additions on the property. | Land | Improvement |
|---|---|---|---|---|
| 2025 | $8,737 | $682,885 | $309,058 | $373,827 |
| 2024 | $8,737 | $669,498 | $302,999 | $366,499 |
| 2023 | $8,638 | $656,372 | $297,059 | $359,313 |
| 2022 | $8,446 | $643,504 | $291,235 | $352,269 |
| 2021 | $8,352 | $630,891 | $285,527 | $345,364 |
| 2020 | $8,229 | $624,425 | $282,600 | $341,825 |
| 2019 | $8,273 | $612,183 | $277,060 | $335,123 |
| 2018 | $7,761 | $600,182 | $271,629 | $328,553 |
| 2017 | $7,570 | $588,417 | $266,305 | $322,112 |
| 2016 | $6,727 | $540,000 | $162,000 | $378,000 |
| 2015 | $6,133 | $492,000 | $147,600 | $344,400 |
| 2014 | $5,588 | $460,000 | $138,000 | $322,000 |
Source: Public Records
Map
Nearby Homes
- 22490 Bayview Ave
- 2272 Kelly St
- 22537 Center St Unit 207
- 3238 Monika Ln
- 22095 Betlen Way
- 3241 Monika Ln
- 3264 Monika Ln
- 3285 Monika Ln
- 3998 Castro Valley Blvd Unit 34
- 3998 Castro Valley Blvd Unit SPC 27
- 23022 Palazzo Del Kayla
- 22561 Mossy Rock Dr
- 23066 Maud Ave
- 1917 Wingate Way
- 0 Jensen Rd Unit 41089385
- 2936 Pickford Way
- 22633 Mossy Rock Dr
- 23049 Lakeridge Ave
- 23661 Glenbrook Ln
- 3913 Castro Valley Blvd Unit 39
- 2555 Ralston Way
- 2603 Perlita Ct
- 22486 Bayview Ave
- 22396 Ralston Ct
- 2799 Ralston Way
- 2775 Perlita Ct
- 22393 Ralston Ct
- 22488 Bayview Ave
- 22372 Ralston Ct
- 2832 Ralston Way
- 2751 Perlita Ct
- 22489 Bayview Ave
- 22369 Ralston Ct
- 22348 Ralston Ct
- 22367 Moselle Ct
- 22491 Bayview Ave
- 22530 Bayview Ave
- 2871 Ralston Way
- 22345 Ralston Ct
- 22343 Moselle Ct