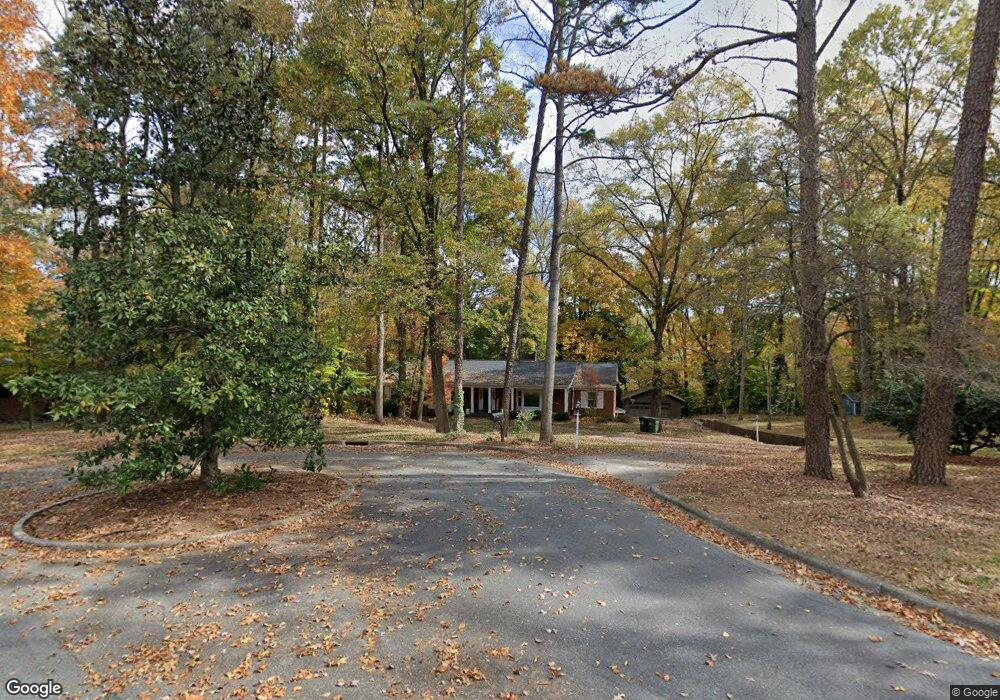
258 Branchwood Cir NE Unit 22 Concord, NC 28025
Estimated Value: $524,000 - $676,330
3
Beds
3
Baths
4,245
Sq Ft
$140/Sq Ft
Est. Value
About This Home
This home is located at 258 Branchwood Cir NE Unit 22, Concord, NC 28025 and is currently estimated at $592,583, approximately $139 per square foot. 258 Branchwood Cir NE Unit 22 is a home located in Cabarrus County with nearby schools including Beverly Hills STEM Elementary, Concord Middle School, and Concord High School.
Ownership History
Date
Name
Owned For
Owner Type
Purchase Details
Closed on
Jan 24, 2025
Sold by
Platinum At Rocky River Llc
Bought by
Nvr Inc
Current Estimated Value
Purchase Details
Closed on
Mar 30, 2021
Sold by
Hargett Stephen Bradley and Hargett Brandy Iona
Bought by
Willeford Jennifer Pare and Willeford Brice J
Home Financials for this Owner
Home Financials are based on the most recent Mortgage that was taken out on this home.
Original Mortgage
$270,000
Interest Rate
2.73%
Mortgage Type
New Conventional
Purchase Details
Closed on
Aug 18, 2016
Sold by
Hurley Pamela Mcwhorter
Bought by
Hargett Stephen Bradley and Hargett Brandy Iona
Home Financials for this Owner
Home Financials are based on the most recent Mortgage that was taken out on this home.
Original Mortgage
$244,150
Interest Rate
3.45%
Mortgage Type
New Conventional
Purchase Details
Closed on
Mar 1, 1959
Bought by
Mcwhorter Charlotte Rider
Create a Home Valuation Report for This Property
The Home Valuation Report is an in-depth analysis detailing your home's value as well as a comparison with similar homes in the area
Home Values in the Area
Average Home Value in this Area
Purchase History
| Date | Buyer | Sale Price | Title Company |
|---|---|---|---|
| Nvr Inc | $315,000 | Chicago Title | |
| Nvr Inc | $315,000 | Chicago Title | |
| Willeford Jennifer Pare | $435,000 | None Available | |
| Pare Willeford Jennifer | $870 | Link Kevin C | |
| Hargett Stephen Bradley | $257,000 | None Available | |
| Mcwhorter Charlotte Rider | -- | -- |
Source: Public Records
Mortgage History
| Date | Status | Borrower | Loan Amount |
|---|---|---|---|
| Previous Owner | Pare Willeford Jennifer | $270,000 | |
| Previous Owner | Hargett Stephen Bradley | $244,150 |
Source: Public Records
Tax History Compared to Growth
Tax History
| Year | Tax Paid | Tax Assessment Tax Assessment Total Assessment is a certain percentage of the fair market value that is determined by local assessors to be the total taxable value of land and additions on the property. | Land | Improvement |
|---|---|---|---|---|
| 2025 | $6,213 | $623,800 | $222,000 | $401,800 |
| 2024 | $6,213 | $623,800 | $222,000 | $401,800 |
| 2023 | $4,843 | $396,970 | $129,000 | $267,970 |
| 2022 | $4,843 | $396,970 | $129,000 | $267,970 |
| 2021 | $4,843 | $396,970 | $129,000 | $267,970 |
| 2020 | $4,843 | $396,970 | $129,000 | $267,970 |
| 2019 | $4,291 | $351,690 | $114,000 | $237,690 |
| 2018 | $4,220 | $351,690 | $114,000 | $237,690 |
| 2017 | $4,150 | $351,690 | $114,000 | $237,690 |
| 2016 | -- | $346,860 | $115,500 | $231,360 |
| 2015 | $2,285 | $346,860 | $115,500 | $231,360 |
| 2014 | $2,285 | $346,860 | $115,500 | $231,360 |
Source: Public Records
Map
Nearby Homes
- 635 Windsor Place NE
- 148 Palaside Dr NE
- 138 Tetbury Ave NE
- 80 Lecline Cir NE
- 1012 Burrage Rd NE
- 457 Birchwood Trail NE
- 84 Lake Concord Rd NE Unit Q
- 629 Camrose Cir NE Unit 45
- 649 Camrose Cir NE
- 653 Camrose Cir NE
- 140 Lake Concord Rd NE Unit D8
- 140 Lake Concord Rd NE Unit B7
- 606 Camrose Cir NE
- 19 Todd Dr NE
- 159 Madison Ave NE
- 722 Wilmar St NW
- 147 Madison Ave NE
- 336 Hamilton Dr NE
- 600 Penny Ln NE
- 545 Wilhelm Place NE Unit 6A, 6B, 5, 4
- 258 Branchwood Cir NE
- 257 Branchwood Cir NE
- 682 Grandview Dr NE
- 688 Grandview Dr NE
- 231 Branchwood Cir NE
- 621 Deveron Place NE
- 676 Grandview Dr NE
- 696 Grandview Dr NE
- 617 Deveron Place NE
- 672 Grandview Dr NE
- 716 Grandview Dr NE
- 683 Grandview Dr NE
- 685 Grandview Dr NE
- 687 Grandview Dr NE
- 679 Grandview Dr NE
- 689 Grandview Dr NE
- 673 Grandview Dr NE
- 613 Deveron Place NE
- 695 Grandview Dr NE
- 336 Lancelot Cir NE